3.0 Observations and Mapping Via Terrestrial Laser Scanning (LIDAR)
Tsunami damage was mapped using terrestrial laser scanning (aka LIDAR). LIDAR has the ability to map deformations at very high resolutions. Topographical change analysis using LIDAR has been discussed in Collins and Sitar, 2006; Collins et al. 2009; Kayen and Collins, 2005; Kayen et al., 2006, Young and Ashford, 2007; Kayen et al., 2007; Olsen et al., 2008; Stewart et al. 2009). The reader is referred to these articles for further information regarding LIDAR and its application for rapid response efforts.
A Leica ScanStation 2 laser scanner (Figure 11) was used for the survey. This scanner is nominally accurate to 3-4mm. It also has photographic mapping capabilities and a nominal max range of 300 m. Because of variability in surface reflections and occlusions, the actual range of dense data is typically 150 m. 360o panoramic overview scans were completed for each setup. Areas of interest were then scanned at higher resolution to capture further detail. Scans at each location were linked via reflective targets (Figure 2) placed over easily identifiable marks or objects. These points were surveyed using a Trimble R8 GPS unit. Because of no available base stations and insufficient time for fast static (~15 min per point), high resolution satellite imagery will be used to verify and provide more accurate geo-referencing. 3D scanning was performed at Pago Pago, Alao, Tula, Leone, and Poloa in American Samoa.
The scanning at Pago Pago maps the location of several debris piles and damaged structures. Only one scan was performed because during the second setup a Tsunami warning was given for American Samoa, making it unsafe to continue scanning. Upon return to the site, crews were there performing cleanup, so no additional scans were performed because of the disturbance to the site.
In Alao, scour around a foundation was mapped using the TLS. The structure atop the foundation was completely destroyed. The foundation was, however, intact. Additional damages and debris of adjacent structures was also mapped. Finally, the scans also show the location of beach sediment that was washed up off of the beach.
In Tula, three scan setups were performed to show the damages to several buildings in the village. A scan was done adjacent to the beach to show some of the coastal erosion and damages and map sediment dislocation.
In Leone, structural damage to buildings and bridges were mapped with five scan setups. The scans also map scouring along a rock wall along the riverside and a substantial amount of erosion that occurred along one of the river banks.
In Poloa, three scans were performed. These scans show the location of the trim line, where the Tsunami waves reached. Also, damages to structures such as a school house were mapped. Additionally, the location of fresh coral deposits on the beach were mapped. Additional scour and erosion was also mapped with these scans.
Images obtained via use of the LIDAR will be shown in the discussion of the geohazards. The LIDAR data was important to the investigation for multiple reasons. First, it provided a quick way to obtain valuable information before clean up was done and vegetation grew back. Second, although no previous data were available, it provided high resolution data allowing for much more accurate damage quantification than traditional methods. Finally, it allows for models to be available for scientists to explore and study without having to travel to the site.
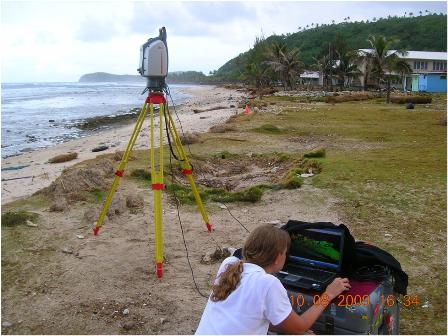
Figure 11. 3D laser scanner setup in Tula, American Samoa. (14 deg 15’04.74”S 170 deg 33’53.47”W)
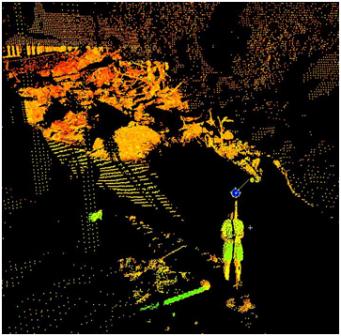 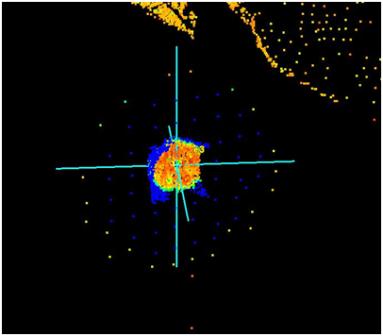
Figure 12. Reflective target setup over common points used to link neighboring scans. Close-up of target shown on right. Scans from Poloa, American Samoa.
|