| |
|
|
|
|
2.0 Geological Setting and Seismological Aspects
2.1 Geologic and Plate Tectonic Setting
At the latitude of the El Mayor - Cucapah earthquake, the Pacific plate moves northwest with respect to the North America plate at about 4.8 cm per year. The principal plate boundary in northern Baja California consists of a series of northwest-trending strike-slip (transform) faults that are separated by pull-apart basins that accommodate northwest-southeast oriented extension. These faults, a subset of which broke in the El Mayor - Cucapah earthquake, are distinct from, but parallel to, the main strands of the San Andreas fault system such as the well-known Cerro Prieto fault. Although some of the faults that broke in this earthquake had been previously mapped, such as the Pescadores and Borrego faults, several others had not (Fig. 2-1). Most notably, the major plate boundary transform fault section that lies southeast of this earthquake’s epicenter is buried by sediments of the Colorado River Delta and had not previously been recognized. This fault has been named, upon its discovery in the field by Javier Gonzalez of CICESE, the Indiviso fault; its existence is clearly a significant new discovery.

Figure 2-1. Geological map of the earthquake source area and surroundings (Fletcher & Spelz, 2009) with El Mayor – Cucapah mainshock and aftershocks re-locations overlain by Egill Hauksson, Caltech.
2.1.1 Geologic Setting of the Earthquake
The Salton Trough, a geologically young north-south trending sedimentary basin, is located east of the epicenter. The Salton Trough is a structural and topographic depression consisting of the San Andreas transform fault system along the eastern portion of the basin. The basin includes a prime agricultural area north of the U.S. border known as the Imperial Valley, and south of the border in Mexico known as the Mexicali Valley. The Imperial Valley includes the northwest trending San Andreas Fault Zone on the eastern side of the Salton Sea, and the San Jacinto Fault Zone on the western side of the Salton Sea. The northwest trending Imperial Fault is located in the central area of the basin and extends from south of the Salton Sea, crossing the border into the northern portion of the Mexicali Valley. Historically, natural and man-made water ways have traversed the agricultural lands in both of these valleys creating high groundwater levels. The Colorado River enters the basin at the southeastern area of the Imperial Valley and flows south along the east side by the Mexicali Valley to the Gulf of California. At the turn of the century water had been diverted from the Colorado River to irrigate the agricultural soils in the Imperial Valley. However, in 1905 the Colorado River broke through flowing westward across the Mexicali Valley eroding two watercourses, the New River in the west, and the Alamo River in the east. Based on mapping by Godfrey Sykes in 1915, the Salton Sea was filled in the Imperial Valley, and Volcano Lake was mapped in the north central Mexicali Valley (Fig. 2-2).

Figure 2-2. Colorado Desert Map by Godfrey Sykes
The earthquake epicenter was located in the farming communities on the western side of the Mexicali Valley, a broad flat extensional sedimentary basin. Geologic field observations of the earthquake damage included: surface fault rupture in the mountain range; several rockfalls in the mountain range; liquefaction features consisting of lateral spreading, sand boils/volcanoes and flooding in the valley. Surface fault rupture occurred in the uninhabited area west of the epicenter in the rugged Sierras Cucapah and El Mayor mountain ranges. The mountain ranges are mapped as Cretaceous granitic rocks including metamorphic rocks, part of what is known as the California Batholith. The surface rupture extended northwest from the epicenter area through the Sierra Cucapah mountain range towards the U.S.-Mexico border. The surface rupture broke the Pescadores and Borrego faults, as well as some previously un-named faults, and triggered minor slip on the southeastern part of the Laguna Salada fault system. Surface faulting is treated in more detail in Chapter 3.
The Mexicali Valley includes the mapped northwest trending Cerro Prieto Fault in the western area, and the Imperial Fault in the central eastern area of the basin. The Cerro Prieto Spreading Center is mapped between the two faults. Both faults are right-lateral strike-slip faults with a northwest-southeast orientation. Faulting in this area has created a series of northeast-southwest striking secondary faults which are known to act as collectors and distributors of hydrothermal fluids generated by heat transfer along a granitic basement from a probable magmatic ascent zone. Geological and geophysical studies have documented a lithologic sequence in the basin with Cretaceous granitic basement rock at a depth of 4,000m, overlain by sandstones, shales, mudstones, then more sandstones and sands. The sands are then overlain by Quaternary poorly consolidated sediments made up of clays, silts, sands and gravels. The Quaternary sediments are known to range from 600m in the area of Cerro Prieto fault to 2,400m in depth near the Imperial Fault to the east.
The Mexicali Valley has been developed with residential communities and farm lands across the wide extensional basin. The area is near sea level and groundwater levels appear to be typically very shallow. Lined and unlined farming irrigation canals traverse the area to provide water to the farms across the basin. Two main river systems exist in this area: the Rio Hardy and Colorado. The Rio Hardy River flows south in the southern portion of the basin. The Colorado River flows from the east side of the basin to the center, and then merges with the Rio Hardy to the south. The Colorado River then flows southward into the Gulf of California. The Quaternary basalt cinder cone of the Cerro Prieto volcano exists at the northwestern portion of the basin. The extensive Cerro Prieto Geothermal Field which is considered one of the largest in the world is located to the east and south of the volcano. A by-product of the geothermal facility operations is a pump system which outlets water into a large man-made evaporation pond adjacent to the southeastern flank of the volcano. This settling pond appears to naturally drain to the south as noted by the marshy area that can be seen on Google Earth photos. A channel flowing from the west side of the pond transports an apparent large quantity of water to maintain the Rio Hardy River to the south. Water may also be flowing north to the New River.
The geologically young sediments across the flat Mexicali Valley in combination with natural and man-made high ground water tables and strong ground motions from the earthquake created a disastrous liquefaction situation. This earthquake provided numerous examples for geotechnical professionals to study the effects on man-made designs. Simple residential structures were able to survive ground motions and liquefaction in terms of life safety as only two deaths were reported due to the earthquake. The wide spread earthquake damage was poorly reported, possibly due to the low death count. However, severe economic damage occurred to homes, the canal water system and roadways. Earthquake induced liquefaction, lateral spreading, sand boils and flooding occurred extensively across the farm land and along the rivers and farm irrigation canals.
2.1.2 Plate Tectonic Setting of the Earthquake
The April 4 mainshock occurred along a strike-slip segment of the North American – Pacific transform plate boundary (Figures 2-3-2-4) along a southeastern extension of the Elsinore and Laguna Salada fault system. As the ridge-transform system in the Gulf of California passes from partially oceanic crust into the continental crust, and as the Colorado River Delta covers the fault system with sediment, complexities occur in the plate boundary. This earthquake manifested the complex nature of the transition to continental transform faulting by combining strike-slip with dip-slip, and lateral faulting with extensional faulting. As described by Fletcher and Spelz (2009) a system of normal faults crop out along the western margin of the Sierra El Mayor and Sierra Cucapah, and the active normal faulting is co-mingled with active strike-slip and oblique-slip faulting in the region, as exemplified by the 1892 earthquake (Mueller and Rockwell, 1995; Hough and Elliot, 2004).
Within the transition from the ridge-transform boundary in the Gulf of California to the continental transform boundary in the Salton Trough, faulting is complex. Most of the major active faults are northwest-southeast oriented right-lateral strike-slip faults that are common in mechanism to the San Andreas fault and parallel Elsinore and San Jacinto faults, that run north of the Mexico-USA border.

Figure 2-3. Plate tectonic setting of the El Mayor – Cucapah earthquake of 4 April 2010. Relative to the North American Plate, the Pacific Plate moves towards the northwest. Ridge segments in the Gulf of California accommodate extension oriented NW to SE, while transform segments accommodate the lateral motion between the plates. In the continental crust, transform motion is accommodated along the San Andreas fault system. The El Mayor – Cucapah earthquake occurred at the transition between the quasi-oceanic and continental crustal regimes, and adjacent to where the thick sedimentary deposits of the Colorado River Delta also occur.
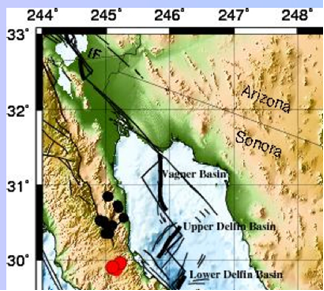
Figure 2-4. The El Mayor – Cucapah earthquake occurred along a fault system that runs parallel to the Cerro Prieto fault, but offset by ~8 km to the southwest. The fault connects the Upper Delfin Basin to the Laguna Salada fault and Elsinore fault system in southern California. Courtesy of Joann Stock, Caltech.
2.2 The Earthquake Source
The moment magnitude, Mw 7.2 El Mayor – Cucapah earthquake of Sunday April 4th 2010, occurred in northern Baja California at 3:40 p.m. PDT local time (22:40 UTC). The event began approximately 45 kilometers southeast of Mexicali and the Mexico-USA border, at a shallow depth along the principal plate boundary between the North American and Pacific plates. Rupture was initially slow and involved normal faulting. After a pause lasting about 6 seconds, the main slip release was asymmetric yet bi-lateral, with rupture propagating rapidly to the northwest along the Pescadores and Borrego faults and aftershocks crossing 10 km's north of the US-Mexico border. Accompanying this was a less rapid southeastward propagation along the newly named Indiviso fault, with aftershocks occurring down to the northern tip of the Gulf of California.
2.2.1 Focal Mechanism
As shown in Figure 2-5, the El Mayor – Cucapah earthquake is a complex event, as indicated by the global teleseismic focal mechanism of Kanamori that shows a significant non-double-couple component, more like a baseball instead of a standard "beachball" (Hauksson et al., 2010). The event may have begun with east-down motion along faults on the eastern edge of the Sierra El Mayor, then progressed to the northwest with oblique slip to both the NW and SE. The oblique motion had a combination of lateral shift to the right and also east-down motion. Overall, the location and focal-mechanism of the earthquake are consistent with the shock having occurred on the main dextral transform plate boundary fault system, but clearly a large component of the fault slip also occurred on the normal-faulting system that accommodates extension as well. While both styles of faulting are typical of this region, it is more common for strike slip and normal faulting events to occur distinctly and separately in a mid-ocean ridge setting with ridge-transform faulting. This earthquake, which occurred at the transition from oceanic to continental faulting, included both transform lateral slip and ridge extension simultaneously.
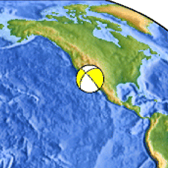
Figure 2-5. USGS Centroid Moment Tensor Solution, indicating a combination of strike-slip and normal (east-down) faulting. Significant non-double-couple moment release was also reported by Hauksson et al. (2010), indicating a complicated earthquake source process.
2.2.2 Finite Fault Model
Two groups are modeling the earthquake source using different approaches and data sets. First is a group at Caltech (Figure 2-6, Wei et al., 2010), and second is a group at UC Santa Barbara (Figure 2-7, Xu et al., 2010). Both groups are using software developed by Prof. Chen Ji of UCSB, but they are using different crustal velocity models and different subsets of data. The emphasis of Wei et al. is more on matching the static deformation of the ground surface from static GPS displacements and InSAR and optical image difference, and they are concentrating on fitting the teleseismic P-wave energy. The emphasis of Xu et al. is on matching the teleseismic S-waves and surface waves, as well as the dynamic GPS waveforms. Even so, the two different approaches are yielding results that have some overall similarities and that agree well with independent data such as surface fault rupture observed by geologists (see Chapter 3 and Fletcher et al., 2010).
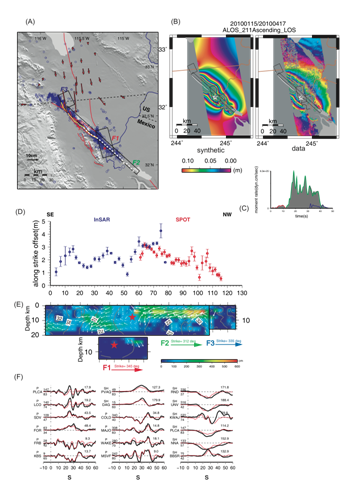
Figure 2-6. Slip distribution on the three fault planes included in the finite fault source model by Wei et al. (2010). (A) The blue circles are seismicity (M>2.5) from 2010.01.01~2010.04.15, relocated with Double Difference method(provided by Egill Hauksson). The geometry of faults used in the inversion are projected to the free-surface and named as F1(red), F2(green) and F3(blue). Arrows to the north of the US and Mexico border are horizontal GPS data(white) and synthetic (red). Yellow dots indicate sampling points of SPOT image and white dots are of azimuthal offset of ALOS track 211.(B) Wrapped InSAR data(right) and synthetic(left) calculated from the joint inversion model. Each color cycle indicates 11.8cm of motion in the line of sight(LOS) direction.(C) Moment rate is plotted with colored lines indicating the contribution of three different faults.(D) Right lateral motion along strike, which are obtained from SPOT observation(red) and azimuthal offsets of track 211 of ALOS PALSAR(blue). (E). The slip model. (F). The comparison of the teleseismic displacement(red) and synthetics(red) generated by the preferred model(E). The station names are indicated to the left of the traces along with the azimuths and epicentral distances in degrees. The peak amplitude in micron of data are indicated above the end of each trace. Figure courtesy of Shengji Wei, Caltech.
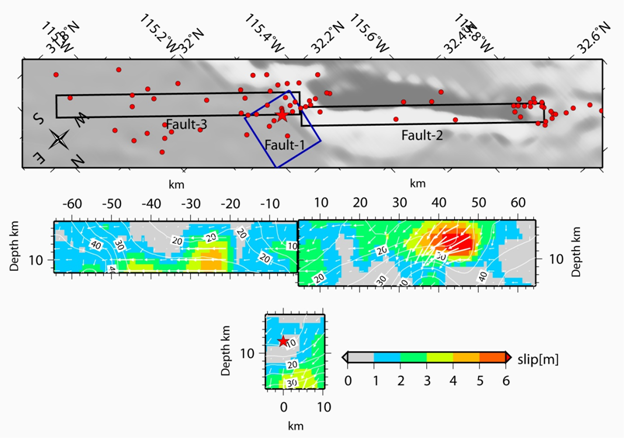
Figure 2-7. Fault geometry and slip distribution obtained from finite-fault source modeling by Xu et al. (2010). Cross-section of slip distribution assuming a multiple fault segment model. Right and left panels show the results in the northwestern and southeastern segment, respectively. The hypocenter location is denoted by the red star and the relocated aftershocks with a magnitude > M4.0 from the SCSN database are shown by red circles. The slip amplitudes are shown in color and motion direction of the hanging wall relative to the footwall is indicated by white arrows. Courtesy of Xu Zhao and Chen Ji, UCSB.
2.2.3 Aftershock Distribution
Seismicity following the mainshock has decayed following typical aftershock distribution patterns as reported at the GSA meeting on 29 May 2010 (Hauksson et al., 2010). As shown in Figure 2-8, aftershocks extend for about 120 km from the epicenter roughly equal distances to the NW and SE. The zone of aftershocks is more precisely located close to the denser network of seismic stations in the northern portion, and near the Mexico-US border a complex set of NE-SW oriented cross-faults is visible in the details of the aftershocks (Hauksson et al., 2010). Along the rupture zone to the SE of the epicenter, although it appears that the aftershock zone is more diffuse and less tightly confined to a fault plane, that is partly the consequence of a sparser network of seismometers in the Colorado River Delta area. In actuality, the aftershock productivity of the southeastern portion of the rupture zone also appears normal. As shown in Figure 2-9, aftershocks are relatively sparse in areas along the fault with large slip.
Although it is typical for most aftershock sequences to have at least one aftershock within one magnitude unit of the mainshock magnitude, in this case no aftershocks of M>6 has yet occurred. With each significant aftershock (M>5) north of the Mexico-US border, SCSN is issuing automated aftershock probability reports. As reported by Hauksson et al. (2010), although there were bursts of activity along the Elsinore and San Jacinto faults above background levels, these were well within the range of previous bursts of activity and have also dropped back down to regular levels. The San Andreas fault system appeared to be unperturbed by the El Mayor – Cucapah earthquake, at least in terms of its seismicity.
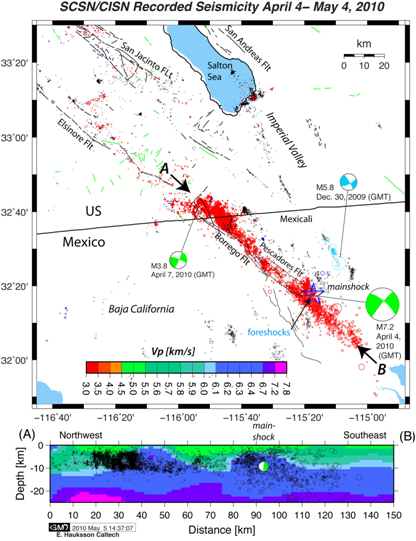
Figure 2-8. Map and along-strike cross-section of the 2010 Mw 7.2 El Mayor-Cucapah earthquake sequence, and related seismicity in 2009. The 2009 seismicity is shown in black, except the M5.8 sequence on Dec. 30 to 31, 2009 is shown in light blue. The immediate foreshocks (blue) before the M7.2 mainshock are barely visible next to the mainshock, shown as a star. Hauksson used a hypoDD and 3D preliminary velocity model, also shown in the cross section. Only the double couple component of the mainshock is shown in map view and cross-section. Digitized faults in Baja were provided by J. Stock. Figure and caption are courtesy of Egill Hauksson of Caltech, and obtained from http://www.scsn.org/ on 30 May 2010.
As of 3 May 2010, the SCSN web site reports the following aftershock occurrence statistics:
M3-M4 = 694
M4-M5 = 84
M5-M6 = 6
M6-M7 = 0
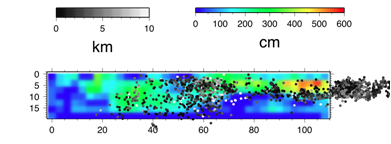
Figure 2-9. A comparison of fault slip by Wei et al. (2010) with the aftershocks re-located by Hauksson et al. (2010) shows that where slip was largest on the fault, there are fewer aftershocks. Figure courtesy of Shengji Wei, Caltech.
The San Andreas and many other faults (e.g., Laguna Salada, Coyote Creek, Superstition Hills), however, did experience triggered creep as reported by Fletcher et al. (2010) and Treiman et al. (2010). This triggered creep phenomenon, however, has been seen many times in the Salton Trough on these same faults and it is thought to be a shallow phenomenon and nothing to raise concern (fault creep such as this used to be thought of as a possible earthquake precursor).
2.2.4 Earthquake History of the Region.
This is an area with a high level of historical seismicity, and it has been seismically active in recent years, notably with the M 6.9 earthquake on the Imperial fault in 1940 and the M 5.8 earthquake of late 2009. The El Mayor – Cucapah event is the largest event to strike in this area since 1892, an event estimated at MW 7.2 (Hough and Elliot, 2004). The 4 April earthquake appears to have been larger than the M 6.9 earthquake in 1940 or any of the early 20th century events (e.g., 1915 and 1934) in this region of northern Baja California.
Earthquakes having magnitudes as high as 7 have been historically recorded from the section of the Pacific/North American plate boundary on which the 4 April 2010 earthquake occurred. The 1892 earthquake is thought to have occurred along the Laguna Salada fault system, but surface offsets associated with the 1892 event (Mueller and Rockwell, 1995) lie farther northwest than the 4 April 2010 mainshock's epicenter. The 2010 event's aftershock zone extends to the northwest, overlapping with the portion of the fault system that is thought to have ruptured in 1892. The 1940 Imperial Valley earthquake approached magnitude 7, though it occurred farther to the north and on the Imperial fault. Both the 1892 and 1940 earthquakes were associated with extensive surface faulting. An event of M 7.0 or 7.1 occurred in this region in 1915, and then a M 7.0 to 7.2 in 1934 broke the Cerro Prieto fault with up to several meters of surface slip.
General aspects of the 1940 earthquake were described by Ulrich (1941) and Richter (1958). Impacts of the 1940 earthquake upon the irrigation water system that are particularly relevant to the topic of this report were described briefly by Ulrich (1941) and Richter (1958), and were also well documented in a report by T. Clark of the Bureau of Reclamation that was later published by Sylvester (1979).
2.2.5 Seismic Hazard of the Region.
The El Mayor – Cucapah earthquake occurred in an area with historical activity and a high rate of plate tectonic motion as shown by both geological slip rates and high rates of geodetic strain accumulation. As such, the Mexicali and Imperial Valley region is indicated as an area of high seismic hazard (Fig. 2-10).
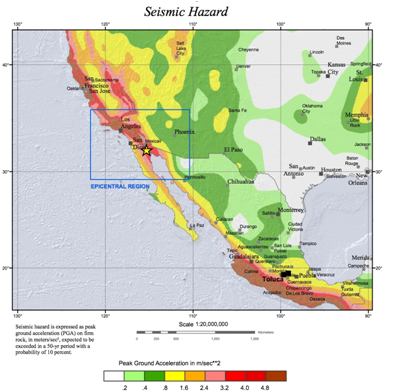
Figure 2-10. Seismic hazard of the region was known to be high prior to this earthquake. From the USGS poster made for the El Mayor – Cucapah earthquake, based on work by the Global Seismic Hazard Assessment Program.
2.3 Crustal deformations from GPS, InSAR, and Optical Image Differencing
Crustal deformation associated with the El Mayor – Cucapah earthquake has been well imaged and measured by the current network of geodetic instruments. Observations from continuously operating GPS stations, most of which are north of the Mexico-US border, are being combined with the many additional survey-mode GPS static displacements that are still being observed in the field at this time. Figure 2-11 shows a series of static displacement measurements, mostly in areas NE of the fault, that indicate a south- to –southeast displacement trend. The maximum observed displacement is 199 mm at station P494 (244.26793, 32.75965).
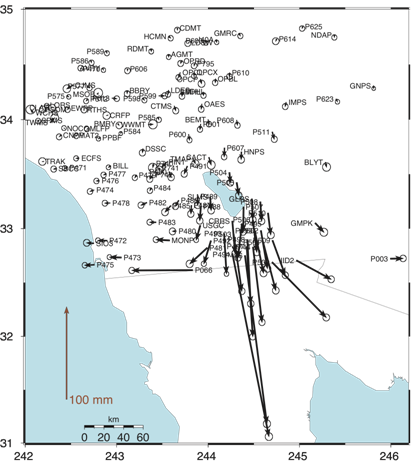
Figure 2-11. Static GPS displacement vectors, courtesy of the Plate Boundary Observatory and Prof. Tom Herring, MIT. For many of these stations, 5 Hz GPS data have been processed as waveforms and used in the finite-fault source model of Xu et al. (2010). Non-telemetered GPS stations south of the Mexico-US border are being observed in the field, and will later be processed and added to complete the displacement field picture closer to the earthquake rupture.
Image differencing of satellite photographs such as SPOT5 pre- and post-event images (Figure 2-12), as well as by Synthetic Aperture Radar (SAR) pixel-tracking methods, has resulted in one type of results produced by Sebastien Leprince of Caltech and Eric Fielding of JPL. As well, interferometric SAR (InSAR) by Eric Fielding and Yuri Fialko of UCSD/Scripps (Figure 2-13) have also been used extensively for this earthquake. Generally speaking, the imagery methods are providing results that are in agreement with field observations of surface faulting. In Figure 2-6 (D) the right-lateral fault offset has been compiled from optical imagery in the NW and InSAR in the SE portion of the fault. The along-strike variation agrees well along the SE Pescadores fault and the Borrego fault where field observations have been made so far (Fletcher et al., 2010). One way in which the initial imagery of the surface rupture traces has been used is to help guide the field search for surface rupture, and to aid in field mapping. Another use of the imagery has been to measure slip along the fault for comparison with, or as a constraint in, the finite-fault source modeling. In the area of the Colorado River Delta from the epicenter to about 50 km to the southeast, InSAR shows right-lateral displacement along the Indiviso fault of 2 to 3 meters. Pre-event imagery and post-event imagery has been made available through the USGS EROS DC HDDS server among other web portals. Pre-event LiDAR 5 m DEM has been made available by CICESE through the opentopography server, and a post-earthquake high-resolution LiDAR survey (17 points per square meter) is planned by NCALM to image the fault ruptures in detail.
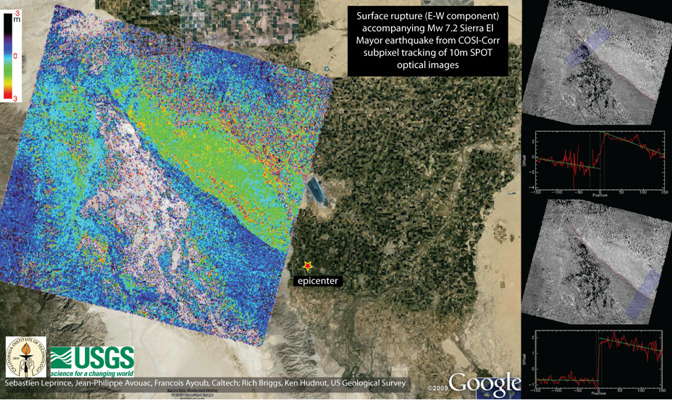
Figure 2-12. Image of ground surface deformation obtained from SPOT prior to and following the earthquake. The green area to the NE of the fault breaks has moved with respect to the dark blue area on the SW side of the fault by as much as 4 to 5 meters in the component shown. Profiles taken across the rupture zone are shown on the right-hand panels at the NW and SE portions of the rupture, indicating several meters of fault slip took place across the fault zone. Courtesy of Sebastien Leprince, Caltech.
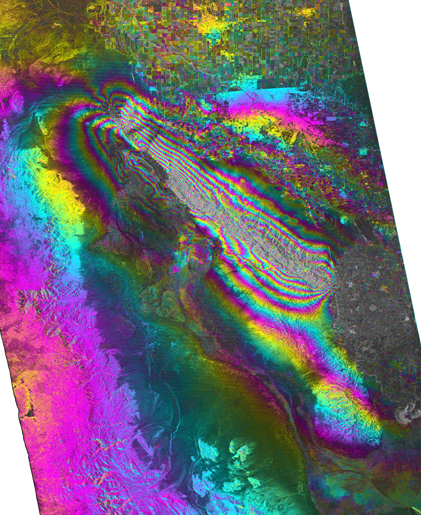
Figure 2-13. JAXA ALOS PALSAR InSAR image from Fielding et al. (2010) showing the intricate pattern of crustal deformation associated with the El Mayor – Cucapah earthquake. Fringes of color each represent 11.8 cm displacement in the radar line-of-sight. The epicenter is in the lower right of this image, and the dense fringe pattern displays the complexity of faulting in the Sierra Cucapah. The fringes form two large oval patterns, one in the SE and the other in the NW, indicating that within the middle of the mountain range the shallow slip was less than at the ends. This matches well with surface faulting observations obtained by Fletcher et al. (2010), who showed that slip on the Pescadores fault in the SE transferred over across a wider zone to the Borrego fault in the NW.
References:
Southern California Seismic Network (2010), “MW 7.2 El Mayor-Cucapah Earthquake Northern Baja California Earthquake,” http://www.scsn.org/ (last accessed 30 May 2010)
http://earthquake.usgs.gov/earthquakes/eqinthenews/2010/ci14607652/ (last accessed 30 May 2010)
http://www.unavco.org/research_science/science_highlights/2010/M7.2-Baja.html (last accessed 30 May 2010)
http://supersites.unavco.org/baja.php (last accessed 30 May 2010)
http://earthquake.usgs.gov/earthquakes/eqarchives/poster/2010/20100404.php (last accessed 30 May 2010)
http://pubs.usgs.gov/gip/dynamic/understanding.html (last accessed 30 May 2010)
http://edcftp.cr.usgs.gov/pub/data/disaster/201004_Earthquake_Mexico/data/ (last accessed 30 May 2010)
Fielding, Eric J., Leprince, Sebastien, Wei, Shengji, Sladen, Anthony, Simons, Mark, Avouac, Jean-Philippe, Lohman, Rowena, Briggs, Rich, Hudnut, Ken, and Helmberger, Don, "InSAR and Subpixel-Correlation Pixel-Tracking Measurement of the 2010 El Mayor-Cucapah Earthquake" http://gsa.confex.com/gsa/2010CD/finalprogram/abstract_174646.htm
Fletcher, J.M.and R.M. Spelz. 2009. Patterns of Quaternary deformation and rupture propagation associated with an active low-angle normal fault, Laguna Salada, Mexico: evidence of a rolling hinge Geosphere; 5: 385-407. doi: 10.1130/GES00206.1
Fletcher, John, Rockwell, Thomas K., Teran, Orlando, Masana, Eulalia, Faneros, Geoff, Hudnut, Ken, Gonzalez, Javier, Gonzalez, Alejandro, Spelz, Ronald, and Mueller, Karl. "The Surface Ruptures Associated with the El Mayor-Borrego Earthquake Sequence" http://gsa.confex.com/gsa/2010CD/finalprogram/abstract_174648.htm
Gastil, G., R. P. Phillip and E. C. Allison (1971), “Reconnaissance Geologic Map of the State of Baja California,” Scale 1:250,000, Universidad Autonoma de Baja California & San Diego State University Department of Geological Sciences, San Diego, California.
Geological Survey of Mexico (1997), “Geological-Mining Charter Mexicali, Baja California-12 I11 and Sonora,” Scale 1:250,000, Council of Mineral Resources, Pachuca, Hidalgo, Mexico.
Hauksson, Egill, Helmberger, D., Hutton, K., Kanamori, H., Wei, S., Yang, W., Vidal, A., Munguiam, L., Diaz, G., and Farfan, F., "Preliminary Seismotectonic Sythesis of the 2010 Mw7.2 El Mayor-Cucapah Earthquake Sequence, Baja California", http://gsa.confex.com/gsa/2010CD/finalprogram/abstract_174754.htm
Hough, S. E. and A. Elliot, Revisiting the 23 February 1892 Laguna Salada earthquake, Bull. Seis. Soc. Amer. (2004), 94(4):1571-1578
Lindsay and Hample (1998), “Geology and Geothermal Resources of the Imperial and Mexicali Valleys,” San Diego Association of Geologists, San Diego, California.
Mueller, K.J., and Rockwell, T.K., 1995, Late Quaternary activity of the Laguna Salada fault in northern Baja California, Mexico: Geological Society of America Bulletin, v. 107, p. 8–18, doi: 10.1130/ 0016-7606(1995)107<0008:LQAOTL>2.3.CO;2.
Richter, C. F. (1958). Elementary Seismology, W. F. Freeman and Co., San Francisco, 768 pp.
Sykes, Godfrey; map 1915
Sylvester, A., Earthquake damage in Imperial Valley, California May 18, 1940 as reported by T. A. Clark, Bull. Seism. Soc. Am., 69, No.2, pp. 547-568, April 1979.
Treiman, J.A., Rymer, M.J., Kendrick, K.J., Lienkaemper, J.J., Weldon, R.J. II, Hernandez, J.L., Irvine, P.J., Knepprath, N., Olson, B.P.E., and Sickler, R.R., "Triggered Slip in Southern California as a Result of the April 5, 2010 El Mayor-Cucapah Earthquake", http://gsa.confex.com/gsa/2010CD/finalprogram/abstract_174668.htm
Ulrich, F. P. (1941). The Imperial valley earthquakes of 1940, Bull. Seism. Soc. Am. 31, 13-31.
Wei, Shengji, Sladen, Anthony, Leprince, Sebastien, Avouac, Jean-Philippe, Fielding, Eric J., Chu, Risheng, Simons, Mark, Helmberger, Don, Hauksson, Egill, and Lohman, Rowena, R. Briggs, K. Hudnut, S. Akciz, "Joint Inversion of Geodetic and Seismic Slip Models for the April 04, 2010 El Mayor-Cucapah Earthquake", http://gsa.confex.com/gsa/2010CD/finalprogram/abstract_174673.htm
Xu, Zhao, Shao, Guangfu, JI, Chen, and Larson, Kristine, Slip Distribution of the 2010 April 4th Baja California, Mexico Earthquake Constrainted Using Teleseismic Body and Surface Waves and High Rate GPS", http://gsa.confex.com/gsa/2010CD/finalprogram/abstract_174671.htm
|
|