4.0 Ground Motion
4.1 Attributes of Recording Stations
As shown in Figure 4-1, the El Mayor-Cucapah main event of April 4, 2010 was recorded by 497 digital strong motion instruments, 168 of which are within 200 km, and 27 of which are in the Imperial Valley/Mexicali region. Figure 4-2 is a relatively close-up view of that region and the triggered instruments. Also shown in Figure 4-1 and 4-2 is the geometric model of the fault as described in Section 2. The closest instruments to the fault rupture are the Geotermica and Michoacan De Ocampo stations (Rrup=Rjb ~ 16 and 18 km, respectively), which are operated by RANM (Red de Acelerografs del Noroeste de Mexico) and are located on soft alluvial sites. The closest instrument in California is El Centro Array #12 (USGS Station 5058), which is at Rrup ~ 16 km, which is located on the soft lacustrine sediments of the Imperial Valley. Most of the stations within the near-source region are similarly soft, lacustrine sediments.
The California strong motion instruments are owned and maintained by California Strong Motion Instrumentation Program (CSMIP) and the US Geological Survey, although several smaller networks also operate in the region.
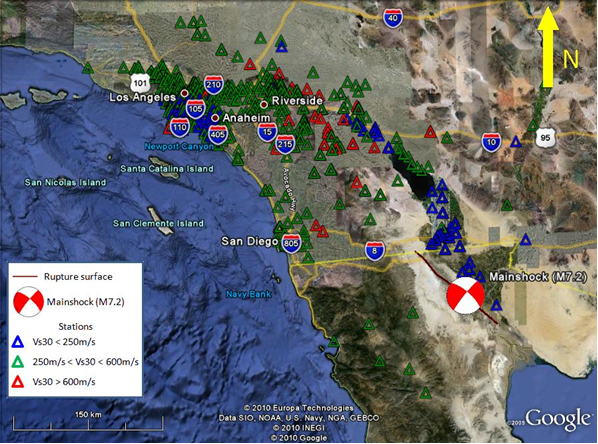
Figure 4-1. Locations of accelerometers that recorded the 4 April 2010 main shock.
Table 4-1. Preliminary assessment of site conditions at ground motion recording stations.
Table 4-2. Geologic description of Wills and Clahan Geologic unit.
4.2 Attributes of recordings
Corrected digital accelerograms were downloaded from the Center for Engineering Strong Motion Data website (http://www.strongmotioncenter.org/, last accessed May 23, 2010). We accessed “Volume 2” data, which had been filtered and baseline corrected by the instrument owners (principally CSMIP and USGS). In subsequent work, we expect uncorrected data to be uniformly processed following the protocols of the NGA project.
The ground motion intensity measures of Peak Horizontal Acceleration (PHA) and Peak Horizontal Velocity (PHV) for the three components have been compiled along with closest distances to the fault plane (Rrup) and closest distances to the surface projection of the fault plane (Rjb). The fault plane that is the basis for these distances was described in Section 2. The data are compared to NGA GMPEs in the following section.
4.3 Preliminary comparisons to GMPEs
Figure 4-3 shows geometric mean PHA, PHV, and PHD plotted as a function of Rjb (closest distance to surface projection of fault). Data are plotted in ranges of Vs30 that capture the typical conditions in Imperial Valley (Vs30 < 250 m/s), the basins in and around Los Angeles (250 < Vs30 < 600 m/s), and rock site conditions (Vs30 > 600 m/s). Also shown in Figure 4-3 are medians (m) and medians ± one standard deviation (s) for the Boore and Atkinson (BA) 2008 GMPE for corresponding site conditions (for PHA and PHV); for PHD the Campbell and Bozorgnia (CB) 2008 GMPE is used.
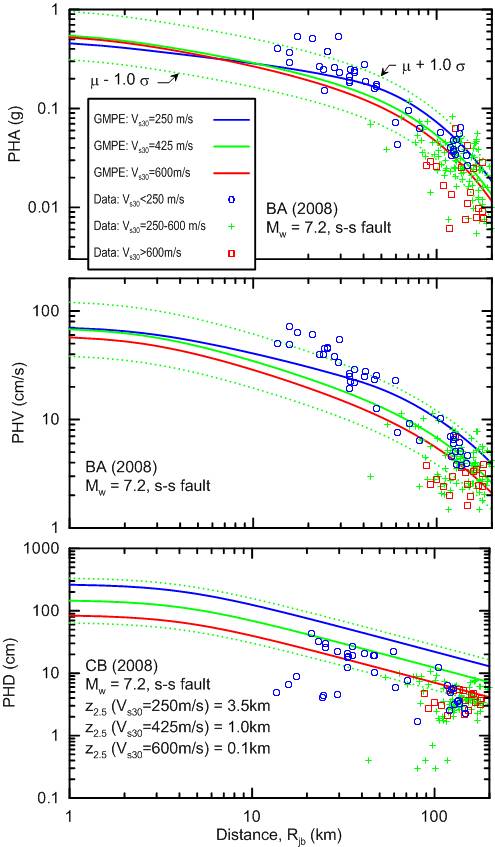
Figure 4-3. Variation of geometric mean PHA, PHV, and PHD with Rjb for recordings and GMPEs (Boore and Atkinson (2008) for PHA and PHV, Campbell and Bozorgnia for PHD).
The GMPE medians visually appear to provide a good match to the data trends in the stiff soil and soft rock site conditions that dominate at distances beyond approximately 60 km. The distance attenuation rate appears satisfactory, as is the median ground motion level and the offset between rock and stiff soil sites. In contrast, the soft Imperial Valley sediments (blue symbols) are underpredicted by the GMPE at Vs30=250 m/s. The misfit increases with decreasing distance, which may result from an overestimation of site nonlinearity.
4.4 Preliminary Evaluation of Selected Recordings
Acceleration, velocity, and displacement histories for a recording station close to the fault (El Centro differential array, Station 5165) are plotted in Figure 4-4a. The data are rotated into the fault normal and fault parallel directions, based on the 220 degree strike of the critical plane from the moment tensor. Note the significant long-period energy content with displacements largely occurring at an apparent period of 6-7 sec. This long-period energy was observed throughout the Imperial Valley, and is thought to result in part from surface waves generated within the basin (R. Graves, pers. communication, 2010).
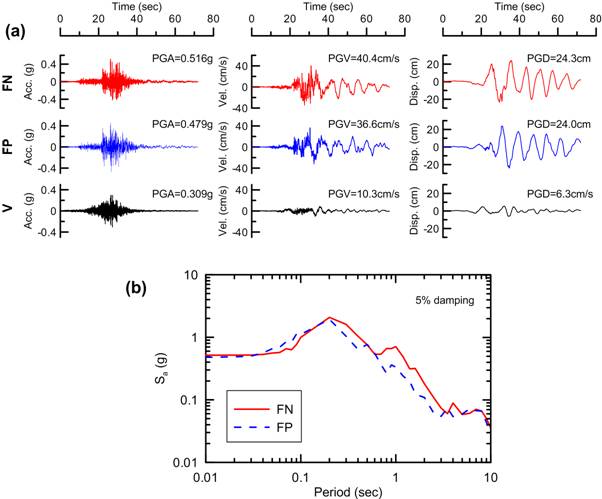
Figure 4-4. Ground motions from USGS Station 5165 (El Centro Differential array) rotated into strike-normal and strike-parallel directions.
Figure 4-4b shows 5% damped pseudo-acceleration response spectra for this station. The data from this single station are not suggestive of significant polarization of ground motion in the fault normal direction, which is an indicator of rupture directivity. Additional data will need to be analyzed before conclusions about directivity effects can be developed.
A useful set of recordings was recovered from the vertical array at the Meloland overpass at Highway 8. Figure 4-5 shows a schematic illustration of the site conditions, the measured shear wave profile, and the recorded ground motion histories (000 azimuth) at various depths through the array. The site data was obtained from the Rosrine web page (http://gees.usc.edu/ROSRINE/, last accessed May 23, 2010). Note that the velocities do not change significantly with depth through the array, although the accelerations are much stronger near the surface than at depth.
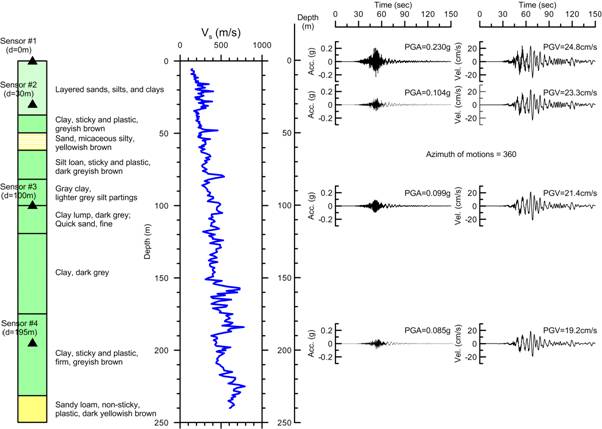
Figure 4-5. Site conditions and recorded ground motions (000 component) at Meloland array, Imperial Valley (site data from Rosrine web page).
References:
Boore D.M. and Atkinson G.M. (2008). “Ground motion prediction equations for the average horizontal component of PGA, PGV, and 5%-damped PSA at spectral periods between 0.01 and 10.0 s,” Earthquake Spectra, 24 (S1). 99-138.
Campbell, K.W. and Bozorgnia, Y. (2008). “NGA ground motion model for the geometric mean horizontal component of PGA, PGV, PGD, and 5%-damped linear elastic response spectra for periods ranging from 0.01 to 10 s,” Earthquake Spectra, 24 (1), 139-171.
Chiou, B.S.-J., Darragh, R., Dregor, D., and Silva, W.J. (2008). “NGA project strong-motion database,” Earthquake Spectra, 24 (1), 23-44.
Wald, D.J. and Allen, T.I. (2007). “Topographic slope as a proxy for seismic site conditions and amplification,” Bull. Seism. Soc. Am., 97(5), 1379-1394.
Wills, C.J. and Clahan, K.B. (2006). “Developing a map of geologically defined site-condition categories for California,” Bull. Seism. Soc. Am., 96(4a), 1483-1501.
|