6.0 Irrigation Canals, Levees, and Earthen Dams
6.1 Canals
As discussed in Chapter 5, liquefaction-induced damage to irrigation canals in the Mexicali Valley and its effect on agriculture is a major impact of the earthquake. However, the GEER team did not perform a thorough reconnaissance of these canals. This chapter focuses on damage to irrigation canals, levees and earth dams in the Imperial Valley north of the US/Mexico border, where the GEER team devoted significant reconnaissance efforts during the week following the earthquake.
6.1.1 All American Canal
The All American Canal (AAC) conveys water 82 miles from the Colorado River into the Imperial Valley of California, providing water for more than 500,000 acres of agriculture and drinking water for at least nine cities; the AAC is the largest irrigation canal in the world. The AAC was constructed in the 1930s and completed in 1942 by the U. S. Bureau of Reclamation. The Imperial Irrigation District operates the canal and its distributaries. Runoff from irrigated farmland sustains the New River and Alamo River, which drain down slope and north to the Salton Sea (These facts were gleaned from literature and exhibits available at the Imperial Irrigation District, Imperial, California).
The AAC generally performed well in resisting the effects of this earthquake. It withstood PGA values in excess of 0.5 g near Calexico. Small slumps thought related to liquefaction were observed along the All American Canal at the Woodbine Lateral and east of the Alamo River, as documented in Figs.6-1 through 6-8. West of the Central Canal diversion and approaching the terminus of the All American Canal at the Westside Main Canal, the number and intensity of observed slumps increased, with slight seepage noted at one locality during Tinsley’s reconnaissance on 4/6/10. Other sites were noted where repairs already had been made. At the Alamo River junction with the All American Canal, lateral spreading on the order of tens of centimeters was measured, but apparently the spreading did not affect the gates or the bridge that crosses the All American Canal at this location (Fig. 5-8). We believe that the sheer massive nature of the levee embankments proved sufficient to resist ground failure on a scale that could have taken the AAC out of service. One wonders what the actual thresholds might be.
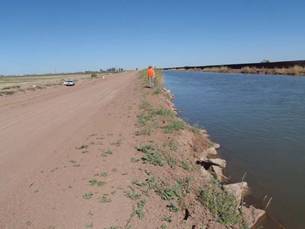
Figure 6-1. Extensional cracking and slumping of north bank of All American Canal at WP 24. Slump is 23 m long. Robert Sickler (USGS) stands at eastern limit of slumped materials.

Figure 6-2. Seemingly minor slump in north embankment of All American Canal with 8 to 10 cm extension. Active seepage present locally. See Figure AAC-3. Photos taken by John Tinsley on 4/6/10 (N32.65482715°, W115.6423856°).

Figure 6-3. Active seep in north embankment of All American Canal, opposite seemingly minor slump photographed above, at (N32.65482715°, W115.6423856°). One of us (Tinsley) stepped into water saturated soft soil to the knee, indicating softening of earthen levee materials was present. This seep likely will require repairs to the AAC levee.

Figure 6-4. View to east; excavator repairing bank slump in north levee of All American Canal (N32.65665248°, W115.6180559°).

Figure 6-5. View to west showing recent repairs to levee and access road along All American Canal. Photos taken by John Tinsley on 4/6/10. (N32.65665248°, W115.6180559°).

Figure 6-6. Wide-angle view of arcuate extensional fracture system and incipient slump in north embankment of All American Canal. Maximum width of fracture set extends 3 to 4 m or more than half-way across the width of the embankment from the canal bank. Extension is towards the canal at left and amounts to >45 mm. No vented earth materials noted. Possible liquefaction at depth Photo taken by John Tinsley on 4/6/10. (N32.65665248°, W115.6180559°).

Figure 6-7. View west across slump and arcuate extensional fractures deforming north bank of All American Canal. Failure is 58 m long and open fractures were plumbed to depths of about 1.35 m. Differential settlement is about 85 mm and total extension across apparent lateral spread is greater than 120 mm. No vented materials noted. Prominence, extent, and amount of apparent displacement of these slumps increase to the west, towards the terminus of the AAC. Photo taken by John Tinsley on 4/6/10. (N32.65369635°, W115.6577703°)

Figure 6-8. Cracking along the All American canal. Photo taken by Jonathan Stewart on 4/5/2010. (N32.674891° W115.371055°).
6.1.2 Westside Main Canal
The Westside Main Canal (WMC) extends northward from the western terminus of the All American Canal (AAC) towards the Salton Sea. A number of lateral canals diverge from the WMC and distribute water for irrigation of crops across parts of the Imperial Valley west of the New River. The WMC did not fail, but there were a number of points at which there was significant liquefaction-related damage to embankments, levees, and diversion structures from the AAC north to Evan Hewes Highway thence to Fites Road (about 6 km southwest of Brawley, CA). Damage is documented along the WMC in Figs. 6-9 to 6-17. Occasional minor effects could be found as far north as Worthington Road, the northern limit of liquefaction in New River alluvium confirmed by the reconnaissance. Slumps and fissures of variable sizes and extents were common from the Fillaree Canal diversion south to the All American Canal. The frequency and intensity of damage generally decreased the further one proceeded to the north, away from the earthquake epicenter and the sediment source represented by the Colorado River. This trend likely reflects the attenuation of strong ground motion with increasing distance from the earthquake source as well as a tendency for natural deposits to exhibit increased content of fines (silt and clay) as distance from the Colorado River increases. Selected images follow that show the types of damage found along the WMC from the diversion at the AAC to the vicinity of Evan Hewes Highway.
At the terminus of the AAC, a diversion structures control flow into the Westside Main Canal and the adjacent Wormwood Canal (WC). Liquefaction-induced lateral spreading is present on both sides of the Westside Main Canal here and on both sides of the adjacent Wormwood Canal, with a visibly displaced concrete liner in the Wormwood Canal. Liquefaction is confirmed by vented sand erupting from extensional fracture sets in all the above areas. Tilted utility poles, a deformed stream gauging station, and settlements of embankments testify the liquefaction here. Both the AAC, WC, and WMC continued to function without interruption.

Figure 6-9. Images show Wormwood Canal flowing north from diversion from All American Canal adjacent to Westside Main Canal. Westside Main Canal is visible to west of Wormwood Canal. Lateral spreads on both sides of Wormwood Canal locally deformed concrete liner, although the canal continued to function. Photos taken by John Tinsley 4/6/10 (N32.65361505°, W115.6624968°)

Figure 6-10. Figure WMC 3. JT4644: Former stage gauge stilling tower tilted from vertical at Westside Main Canal; other nearby structures visible in foreground also tilted from plumb. No vented materials visible locally. Liquefaction seems likely but cannot be confirmed absent vented materials. Photo taken by John Tinsley 4/6/10 (N32.65361505°, W115.6624968°).


Figure 6-11. View north along west bank of Westside Main Canal, showing utility poles tilted from plumb owing to lateral spreading ground failure. Area around base of poles shows light-toned vented sand from sand boil activity. Venting of sand in proximity to the poles probably reflects soil-structure interaction involving liquefaction. Photos taken by John Tinsley 4/6/10 (N32.65370358°, W115.6624656°).

Figure 6-12. Principal fracture linking two tilted utility poles, showing vented sand with some water still seeping from pressurized strata in subsurface 3 days after the earthquake; role of significant aftershocks in maintaining elevated pore-fluid pressures is uncertain. Green plastic scale is 15 cm long. Photo taken by John Tinsley 4/6/10 (N32.65370358°, W115.6624656°)

Figure 6-13. Liquefaction-induced lateral spreading ground failure near junction of Westside Main Canal and All American Canal. Pipe or conduit as shallow subgrade structure is exposed in open extensional fracture; pipe is offset 70 mm. Vented sand partly fills fracture underneath the offset pipe. Spreading vector was towards Westside Main Canal. Photo taken by John Tinsley 4/6/10 (N32.65291264°, W115.6621271°).

Figure 6-14. Wide-angle perspective of extensional fractures at head scarp of lateral spread crossing embankment in foreground and including Westside Main Canal’s service road. Riparian vegetation is tilted towards canal owing to this lateral spread ground failure that showed about 100 mm extension at head scarp and subparalleled the canal for about 100 m. Photo taken by John Tinsley 4/6/10 (N32.6768895°, W115.6725699°)

Figure 6-15. Collapse of Westside Main Canal’s western access road. Undermining of road surface probably reflects pre-earthquake piping along transverse subgrade structures or other zone of seepage from canal. No vented liquefied materials noted in area. Relation to liquefaction is unclear. Photo taken by John Tinsley 4/6/10 (N32.67508605°, W115.6713126°).

Figure 6-16. View of west side of Westside Main Canal, showing recent bank failure and slumping of vegetation into canal. These sorts of failures were extremely common on both sides of the WMC throughout the examined reaches. Number, frequency and persistence of such failures increased towards the south and west. Bank failures of this type did not generally extend more than a meter or so into bank of canal, thus posed little threat to canal’s integrity. Photo taken by John Tinsley 4/7/10 (N32.7502516°, W115.7523341°).

Figure 6-17. View to north showing lateral spread and head scarp nucleated east of the Westside Main Canal’s east levee and service road. The WMC (visible in left background) was not affected, but the lateral spread is impressive and persists for nearly 200 m. Displacement vector is away from WMC and towards a drainage canal located sub-parallel to and east of WMC. Grading equipment has made at least one pass, dumping new material into the zone of extensional cracking and lateral spreading. Photo taken by John Tinsley on 4/7/10 (N32.73499042°, W115.7300061°).
Liquefaction-induced lateral spread ground failure damaged the diversion controls and liner of a lateral canal off of Westside Main Canal at [32.73126525°, -115.7144168°], as shown in Figs. 6-18 and 6-19. Repairs by Imperial Irrigation District personnel were progressing well on 4/7/10; wing walls for controlling the flow of water to the lateral canal freshly poured and still in the forms and preparations being made to pour a new lining for the lateral canal.


Figure 6-18. Lateral spreading fractured east levee at Westside Main Canal. Structure controlling flow to lateral irrigation canal was damaged when ground was displaced eastward away from Westside Main Canal. Newly poured foundation and wing wall for outlet to lateral irrigation canal from Westside Main Canal. Photos taken by John Tinsley on 4/7/10 (N32.73126525°, W115.7144168°).


Figure 6-19. Repair crew adjusts grading equipment to shape walls of lateral irrigation canal, prior to forming walls and bottom of canal and pouring concrete to repair effects of lateral spread ground failure. View to west with Sunrise Butte in distance, showing re-shaped lateral irrigation canal prior to forming and pouring new concrete walls and bottom. Photos taken by John Tinsley on 4/7/10 (N32.73126525°, W115.7144168°).
West levee of Westside Main Canal at [32.72351182°, -115.6974642°]. Significant lateral spread ground failure damaged the levee (Figs. 6-20 and 6-21). Liquefied earth materials locally present in lower portions of extensional fractures. Extensional fractures traverse about 50% of the width of the road atop levee. This zone of ground failure is about 40 m long and 18 m wide. Maximum vertical separation is about 60 cm; cumulative maximum horizontal displacement exceeds 1 m across the zone of extension.

Figure 6-20. View to north showing portion of ground failure at WP 110. Exposed tape (scale) is 1 m long. Photos taken by John Tinsley on 4/7/10 (N32.72351182°, W115.6974642°).

Figure 6-21. Close view using flash to illuminate shadows showing graben developed along system of extensional fractures in liquefaction-induced lateral spread ground failure near position of tape in figure WMC-15. Photos taken by John Tinsley on 4/7/10 (N32.72351182°, W115.6974642°).
West side of Westside Main Lateral at [32.73074985°, -115.7135402°]. A liquefaction-induced lateral spread caused 14 cm of differential settlement transverse to the levee along a 12 m long fracture system that effectively depressed the levee crest. Transverse fractures to levees can be significant threats to the integrity of a water delivery system or to a flood control structure. Liquefied earth materials were vented as so-called sand boils adjacent to the levee (Figs. 6-22 and 6-23).

Figure 6-22. View to east across Westside Main Canal (in background) showing transverse fracture and settlement that offsets the surface of the levee about 14 cm. Scarplets trending parallel to the canal face the levee’s long axis, indicating that the levee apparently sank into a liquefied substrate. Tape is 1 m long.

Figure 6-23. Vented silty sand and sandy silt emanate from fractures trending transverse to levee's long axis on west levee of Westside Main Canal near WP 112. Aligned vents in background likely indicate persistent fracture trends that follow liquefiable materials that sub-parallel and underlie the levee. Photos taken by John Tinsley on 4/7/10 (N32.73074985°, W115.7135402°).
Westside Main Canal at [32.84269821°, -115.7411484°] (Figs. 6-24 and 6-25). Probable lateral spread ground failure extends across entire width of levee road. Total width of ground failure exceeds 10 m and extends for about 100 m adjacent to WMC. No vented earth materials noted here; slight differential subsidence and extension increase progressively toward channel of WMC. Liquefaction possible but uncertain. This type of ground failure was fairly common north of Evan Hewes Road, where ground motions perhaps were becoming attenuated and ground failures were rather incipient.

Figure 6-24. C. Pridmore walks out an extensional fracture in levee road along WMC. Vegetation along canal bank is tilted towards the channel and displaced tens of centimeters with most of the deformation being associated with a large fracture that subparallels canal’s bank. Photo taken by John Tinsley on 4/8/10 (N32.84269821°, W115.7411484°).

Figure 6-25. View sub-parallel to bank of WMC, showing extensional fractures associated with canal bank failure. Extensional cracking extends across entire levee road, with canal side being down and spreading vector towards the canal. Displacements were small and neither seepage nor vented earth materials were noted. Photo taken by John Tinsley on 4/8/10 (N32.84269821°, W115.7411484°).
Westside Main Canal along Fites Road
This location is singled out from the remainder of Westside Main Canal (WMC) observations because of its potential significance. Seepage from the Westside Main Canal along Fites Road apparently saturated or mostly saturated fill underlying a service road adjacent to an agricultural drain. The main shock of 4/4/2010 triggered what may have been liquefaction-related ground failure of the drainage ditch’s wall materials, although no vented liquefied materials were observed. The zone of failure corresponded to a reach of the canal levee where water was puddled locally along the service road. The failure zone did not persist beyond the observed limits of water at the surface. This is an instance where active seepage from the adjacent WMC was apparently not noted nor repaired promptly. The presence of this seepage water probably facilitated the observed ground failure. This site is documented in Figs. 6-26 to 6-29.

Figure 6-26. Overview of southeast aspect of levee confining Westside Main Canal near Fites Road, showing minor extensional cracking that may or may not be related to inferred seepage from canal. Extensional cracking extended for a mere fraction of the length of the slope failure adjacent to the drainage channel at left. No vented liquefied materials were observed along the Westside Main Canal levee. Photo taken by John Tinsley on 4/8/10 (N32.84269821°, W115.7411484°).

Figure 6-27. View to south along west side of access road between Westside Main Canal levee on the right and service road. No tracing tests were performed here, but we speculate that seepage from Westside Main Canal sustains the wet ground and the puddle allowing for ground shaking possibly to have triggered liquefaction at depth and thus to have caused the observed ground failure along the drainage as shown in subsequent photos. Photo taken by John Tinsley on 4/8/10 (N32.84269821°, W115.7411484°).

Figure 6-28. View to northeast showing probable lateral spread ground failure noted along Fites Road near WP 136. Wet sediment noted on west side of access road is believed to be seepage from Westside Main Canal and the likely source of the water that dampened the now-failed materials after percolating beneath the road. Slump reflects displacement to the right of the photo, and visibly narrows channel in middle ground of image. Tim McCrink at left and Cynthia Pridore in distance give scale. Photo taken by John Tinsley on 4/8/10 (N32.84269821°, W115.7411484°).

Figure 6-29. View of toe of slope failure where it closes the channel of the drainage canal near WP 136, adjacent to Fites Road and Westside Main Canal. Ground failure narrowed the channel at two different points along the zone. Photo taken by John Tinsley on 4/8/10 (N32.84269821°, W115.7411484°).
6.1.3 Rosita Canal north of West Alamo Road
The most distant occurrence of liquefaction found for this earthquake was west of the town of Holtville along the Rosita Canal. Liquefaction occurred on both sides of the canal over a distance of 800 m north of the intersection of E. Alamo and Bell roads (Fig. 6-30). At the southeastern end of the damaged area, lateral spreading on both sides and towards the canal was observed despite recent grading of the canal levees. On the south side of the canal, between the canal and E. Alamo Road, a graben that ranged from 1 to 2 m wide formed 10 to 15 m away from the canal bank. Evidence of vented sand was found at the base of telephone/power pole in this same area.
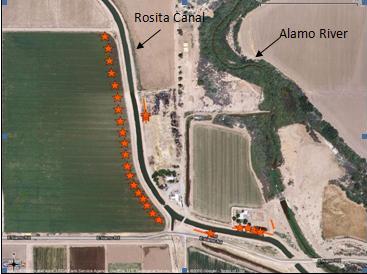
Figure 6-30. Diagrammatic sketch on a Google Maps base showing liquefaction features along the Rosita Canal west of Holtville. Lines represent approximate locations of cracks and fissures and star symbols represent approximate sand boil locations.
Immediately northeast of the canal, a series of lateral spread fissures, some filled with vented sand, traverse through the front yard of a residence that fronts onto the levee road (Fig. 6-31). Sand boils were observed on both sides of the fissure, but the levee road here was also recently graded limiting deformation observations. A continuous line of sand boils was observed in an agricultural field on the west side of the Rosita Canal from E. Alamo Road north 500 m to the end of the field (Fig 6-32). The sand boils did not continue into the next field. These sand boils were up to 1 m in diameter, and some were found to be wet on 4/11/10 suggesting aftershock re-activation (Fig. 6-33).
Extensive levee repairs were underway on the east side of Rosita canal on the morning of 4/11/10 and access was not possible. Repairs were completed by the afternoon when access was gained. The repairs included the import of fill by several large dump trucks, leveling of the levee top, and tamping of the outboard side of the levee with the bucket of a large track-mounted excavator. In the small field on the east side of the canal one large and a few small sand boils were observed (Fig. 6-34). The large sand boil had an unusually large crater that was 1 m long, 20 cm wide and 40 cm deep. The sand boils formed along a linear fissure about 40 m east of the canal. A parallel fissure 30 to 35 m east of the canal showed evidence of water seepage with little or no sediment (Fig. 6-35). Because the focus of the levee repairs was adjacent to this fissure, it appears that liquefaction may have damaged the levee and allowed significant seepage into the field.

Figure 6-31. Lateral spread fissures running through a fenced yard on the north side of the Rosita Canal, northeast of the intersection of E. Alamo and Bell roads. Sand boils were found in several areas on both sides of the fissure, and vented sand filled some parts of the fissure. The levee road, just to the right of the picture, had recently been graded obliterating any liquefaction features that may have existed. View to the east. Photo taken by Tim McCrink on 4/11/10. (N32.818558°, W115.437807°).

Figure 6-32. Continuous string of sand boils in an agricultural field west of the Rosita Canal. View to the southeast. Photo taken by Cindy Pridmore on 4/11/10. (N32.818924°, W115.440264°).

Figure 6-33. A pair of sand boils on the west side of the Rosita Canal that were wet 7 days after the earthquake, suggesting reactivation by aftershocks or subsurface conditions enabling prolonged seepage. Photo taken by Tim McCrink on 4/11/10. (N32.820924°, W115.441093).

Figure 6-34. Large sand boil formed along a fissure on the east side of the Rosita Canal. The sand boil has an unusually large crater and the concentric cracks suggest subsequent caving. View to the south and the Rosita Canal is to the right of the picture. Photo taken by Cindy Pridmore on 4/11/10. (N32.821126°, N115.440252°).
Figure 6-35. Evidence of excessive seepage from the east side of the Rosita Canal. The fissure shown is slightly closer to the levee than the fissure related to the sand boils shown in Figure RC5. View to the north. Photo taken by Tim McCrink on 4/11/10. (N32.821126°, W115.440252°).
Liquefaction was not reported at this location from the 1979 Imperial Valley earthquake, though liquefaction was suspected in slumps into drains at Zenos Road, 1.2 km southeast and at Worthington Road, 2.8 km northeast (Youd and Wieczorek, 1982). The occurrence of extensive liquefaction from this more distant earthquake suggests that pre-earthquake seepage from the Rosita Canal in this area may have created liquefaction-susceptible conditions.
6.2 Levees and Earthen Dams
6.2.1 Fig Lagoon/Fig Lake
The impact of earthquake shaking at Fig Lagoon emerges as one of the more remarkable case histories encountered in this investigation. An earthen embankment with a concrete outflow control structure at its northern end impounds Fig Lagoon. The lake itself is situated on the west side of the Holocene floodplain of the New River, which is in turn incised into older Holocene and Pleistocene alluvial deposits that form uplands on either side of the New River. The New River flows along the east side of the valley constrained by its own levee system. Tinsley and Sickler visited Fig Lagoon on 4/7/10. Some grading had been done towards the south end of the impounding levee, and abundant vented sand indicated that liquefaction of underlying New River deposits was prevalent, with numerous lateral spreads, occurrences of differential subsidence and sand blow activity dominating the landscape on the active floodplain. Further north, liquefaction-induced lateral spreads had resulted in subsidence and near-foundering of the impounding levee. An outwash channel had developed there, indicating substantial amounts of water had decanted from the lake via the channel onto the adjacent floodplain in the area between Fig Lagoon’s dam and the New River. Eyewitness accounts of the appearance of widespread floodwaters on the floodplain following the earthquake were substantiated by the presence of standing water down valley from the liquefaction-induced outflow channel location on Fig Lagoon’s dam. We were able to photograph the water yet standing on the floodplain from a vantage point on the uplands to the east. As we continued the reconnaissance to the northern end of the levee impounding Fig Lagoon, evidence of liquefaction continued to be widespread, involving chiefly the alluvial materials underlying the levee, with consequent lateral spread failures induced into the overlying levee itself. It became apparent that riparian vegetation was emergent, lake bottom sediment was freshly exposed, indicating recent and rapid draining of the level of Fig Lagoon, amounting to as much as 0.5 m. So much differential displacement of the land surface had occurred in result of liquefaction, we despaired of making any precise measurements of net vertical displacement or subsidence, without bringing in control from benchmarks well outside the zone of liquefaction.
We speculate that the following combination of earthquake-triggered events impacted Fig Lake and its impounding levee:
1. Earthquake shaking triggered liquefaction in late Holocene alluvium of New River beneath the levee impounding Fig Lagoon, and locally within the fill materials themselves. Lateral spreading and subsidence of the levee occurred in several places, lowering the levee crest nearly to the level of the water in Fig Lagoon.
2. We speculate that seiche wave activity then developed in Fig Lagoon, and the surging resulting in one or more episodes of water sloshing from within the lake and overtopping the levee where it had been damaged by liquefaction-triggered permanent ground deformation. We infer that seiche wave activity is indicated to help trigger the overtopping. If liquefaction had lowered the levee crest well below the lake level, the dam likely would have completely washed out and failed completely. As it was, a small seiche would have enabled significant volumes of water to escape and produce the observed flooding, but not to concentrate in a narrow channel and thus be able to erode completely through the impounding levee.
3. The escaping water did erode a shallow, wide channel into the levee, ultimately forming the well-preserved prominent outwash channel we photographed. We don’t know if other outwash-related features were obliterated by the locally extensive grading that had occurred prior to our arrival at the southern end of the Fig Lagoon levee system.
We conclude that there was serious potential for a catastrophic failure of Fig Lagoon’s levee or dam, and that this series of events qualifies as a “near miss” occurrence caused by this earthquake. We illustrate this event with a series of photographs (Figs. 6-36 to 6-45) illustrating the remarkable features we observed.

Figure 6-36. View to north and west from upland on east side of New River channel, showing lowland still flooded by standing water and Fig Lagoon at left beyond the linear brownish straight feature that is the impounding levee located along the far side of the flooded lowland. New River is located on the camera side of the trees in the foreground, flowing along the east side of its floodplain. The flooded lowlands were the initial clue that Fig Lagoon was going to be an interesting case of liquefaction-induced ground failure. Photo taken by John Tinsley about 30 m northwest of (N32.76770649°, W115.6920704°).

Figure 6-37. View is to south, along levee impounding Fig Lagoon, showing major breach in levee owing to liquefaction-induced lateral spreading ground failure and probably seiche wave activity. Standing water in breach in middle ground of photo is at approximate level of water in Fig Lagoon. Lake is to left of riparian vegetation in left foreground of image.

Figure 6-38. View to SW showing breach in Fig Lake levee created by liquefaction-related lateral spread ground failure and settlement. Fig Lake is visible through the vegetation on the right of the image. Standing water is about at the level of Fig Lake. Post-earthquake draining of Fig Lake occurred near here through an overflow channel that was eroded by escaping lake water. Photos taken by John Tinsley from vantage points located on either side of (N32.76774589°, W115.6953568°).

Figure 6-39. Outwash channel formed in result of overtopping by lake water along portion of Fig Lake levee lowered by earthquake triggered liquefaction and lateral spreading. Yellow tape to right of Robert Sickler’s feet is 1 m long.

Figure 6-40. Close view showing north end of levee failure. Vented sand requiring liquefaction is visible in and along some of the extensional fractures in this zone of lateral spreading. Scarped face levee axis, indicating levee sank differentially into liquefied substrate. Photos taken by John Tinsley on 4/7/10 from vantage points located on either side of (N32.76774589°, W115.6953568°).

Figure 6-41. Zone of liquefaction-triggered ground failure in dam of Fig Lagoon south of the overflow channel depicted in preceding photos. Scarps in levee face levee axis, indicating differential subsidence into a liquefied substrate probably occurred.

Figure 6-42. Sand boil deposits presently underwater atop late Holocene floodplain deposits of New River at Fig Lagoon. It is not certain if sediment was erupted subaqueously or if inundation postdated eruption of liquefied materials. Preservation of vented materials is morphologically excellent, so we infer that the subaqueous eruption is probable. Photos taken by John Tinsley on 4/7/10 at (N32.76978764°, W115.6945083°).

Figure 6-43. Outfall area of Fig Lagoon. One overflow pipe is visible in middle ground of image. Algae-covered concrete rip-rap and emergent vegetation and sediment indicate recent lowering of level of water in Fig Lagoon.

Figure 6-44. View of east shore of Fig Lagoon from vantage point located near outfall control culvert, showing emergent vegetation and lake bottom sediments reflecting recent and rapid drainage of Fig Lagoon. Photos taken by John Tinsley on 4/7/10 (N32.77108164°, W115.6946948°).

Figure 6-45. View from WP 66 on uplands east of Fig Lake showing recently emergent grayish brown lake bottom sediment locally covered with reddish brown vented sand. Image confirms recent lowering of water of Fig Lake, apparently through the overflow channels photographed above. Photos taken by John Tinsley on 4/7/10 (32.76229204°, W115.7035513°).
6.2.2 Sunbeam Lake Dam
Sunbeam Lake is a recreational lake operated by Imperial County Division of Parks and Recreation and is located on Drew Road, approximately halfway between the town of Seeley and Interstate 8. The lake itself is a narrow body of water, averaging about 70 meters wide that extends about 1.8 kilometers from Drew Road southeast to I-8 (Figs. 6-46 and 6-47). A small extension of the lake continues to the south side of the interstate highway, presumably via a culvert. It was reported by the park ranger that the lake ranges from 3 to 5 meters in depth. Owing to the relatively shallow lake depth and low relief of the area, the Sunbeam Lake Dam is only about 5 meters above the lake’s outflow into the Seeley Drain on the west side of Drew Road.
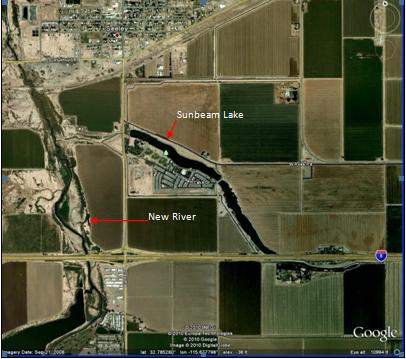
Figure 6-46. Location map of Sunbeam Lake, Imperial County. The dam is located at the far west end of the lake near Drew Road. Town of Seeley is at top left of image.
Earthquake shaking from the main shock on 4/4 caused liquefaction of the dam crest, of the gently sloping embankment between the dam crest and Drew Road, and in Drew Road fill materials. The Sunbeam Lake Park Ranger witnessed water “geysering” through the asphalt surface of Drew Road, and photographs taken soon after the earthquake show both settlement and lateral displacement of the road (Fig. 6-48). Unfortunately, the road had been leveled with dirt by the time any earthquake investigators arrived, and no displacement could be measured. The road fill above the outlet pipes was washed away during or soon after the earthquake (Fig. 6-49), exposing several types of utilities and breaking at least one of them. It was reported that a gas main was also located in the roadbed on the east side of Drew Road.
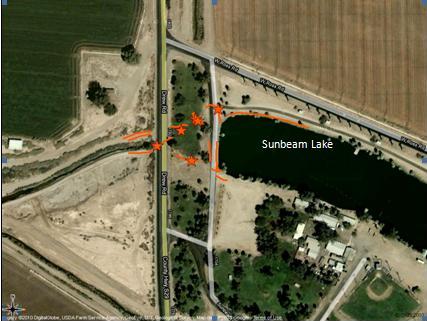
Figure 6-47. Diagrammatic representation of the damage observed at Sun Beam Lake Dam and Drew Road. Lines represent approximate areas where fissures and cracks were observed, and stars show the approximate locations of sand boils.
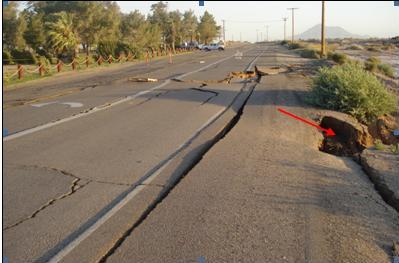
Figure 6-48. Liquefaction-related settlement and lateral spreading of Drew Road, immediately west of Sunbeam Lake Dam. View is toward the south with El Centinela Peak in the distance. An eyewitness reported water “geysering” out of the pavement during the earthquake. The outlet pipe from Sunbeam Lake as well as that from a significant irrigation drain enter the stream to the right of the prominent slump in the center-right of the photo, indicated by the arrow. Both apparently were damaged by liquefaction. Photo taken 4/4/10; courtesy of the Imperial County Planning and Development Services Department. (N32.784852°, W115.690551°).

Figure 6-49. Close-up of the slump on the west side of Drew Road mentioned in the previous photo. Several utilities are exposed and some are broken. The outlet flow from Sunbeam Lake and probably the Seeley irrigation drain are just visible on the right. Photo courtesy of the Imperial County Planning and Development Services Department. (N32.784852°, W115.690551°).
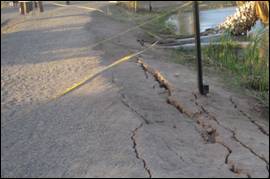
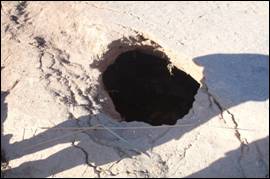
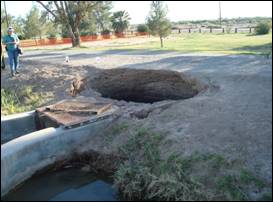
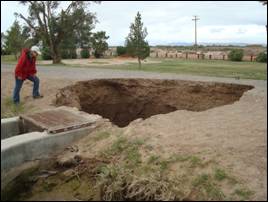
The south half of the dam crest settled vertically between 15 and 30 cm and the upstream face spread toward the lake. East-west trending fissures on the south side of the gentle slope between the dam crest and Drew Road showed westward displacements of about 4 cm. A sinkhole formed two days after the earthquake and continued to grow during the week-long reconnaissance effort (Fig. 6-52).

Figure 6-50. View of the south end of the Sunbeam Lake Dam crest, looking east. Photo was taken soon after the earthquake. Dam crest to the left has dropped 15 to 30 cm relative to the area to the right of the large crack in the center of the photo. Photo courtesy of the Imperial County Planning and Development Services Department. (N32.784472°, W115.689984°)

Figure 6-51. View of the south end of the Sunbeam Lake Dam crest, looking northeast. Photo was taken 8 days after the earthquake. Transverse crack on the crest is larger and new cracks parallel to it are now visible. Cracks in asphalt are more pronounced and several newly visible cracks extend into the lawn area. The continued deformation is thought to be the result of a week of strong aftershocks. Photo taken on 4/12/10 by Tim McCrink. (N32.784472°, W115.689984°)
Figure 6-52. Time sequence photographs of the sinkhole that formed on the Sunbeam Lake Dam: a) the dam crest and outlet weir on the day of the earthquake; b) early stage of sinkhole formation on the morning of 4/7 -person whose shadow partially covers the sinkhole is standing on the outlet weir (photo by John Tinsley on 4/6); c) sinkhole on the evening of 4/8 (photo by Tim McCrink); d) sinkhole on 4/12 (photo by Tim McCrink). (N32.784784°, W115.689816°).
|