PRELIMINARY REPORT ON THE GEOTECHNICAL ENGINEERING
ASPECTS OF THE JUNE 15 AND JUNE 21, 1999, M…XICO, EARTHQUAKES OF THE CHURCHES.
J. M. Pestana, M. J. Mendoza,
J. M. Mayoral,
R. E. S. Moss,
R.B. Sancio,
R. B. Seed,
J. D. Bray, and M. P. Romo.
1. INTRODUCTION
2. SEISMOLOGICAL AND GEOLOGICAL OBSERVATIONS
3. STRONG GROUND MOTION
3.1 Attenuation Relationships
3.2 Site Effects in Puebla City
3.3 Microzonation of Puebla City
3.4 Effects of the June 15, 1999, Earthquake on the City of Puebla
4. OTHER GEOTECHNICAL CONSIDERATIONS
4.1 Effects of Ground Motions on Some Structures
4.2 Landslides
4.3 Ground Failure
4.4 Soil Liquefaction
4.5 Performance of Earth Structures
4.6 Miscellaneous
5. ACKNOWLEDGMENTS
6. REFERENCES
INTRODUCTION
A seismic event of moment magnitude 7.0 (USGS)
struck the central region of Mťxico on June 15, 1999, at 15:42 hours (20:42
GMT). The epicenter of the earthquake was located near the border of the states
of Puebla and Oaxaca. A second event of moment magnitude 6.3 (USGS) was recorded
on June 21, 1999, at 12:43 hours (17:43 GMT), also affecting the central region
of Mťxico.
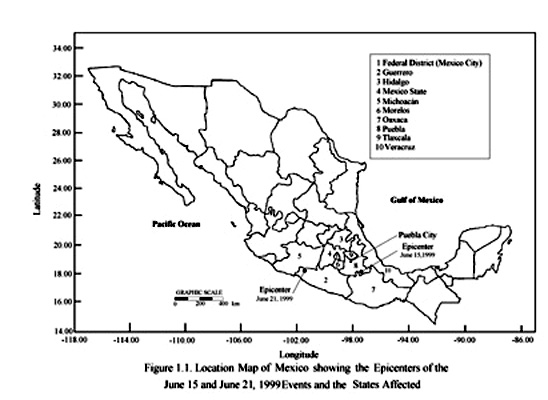
Figure 1.1 shows the location of the epicenters of these two seismic
events, which together affected cities in the states of Guerrero, Hidalgo,
Mťxico, MichoacŠn, Morelos, Oaxaca, Puebla, Tlaxcala, Veracruz and the Federal
District.
The first event was felt in the Federal District (Mťxico City),
approximately 250 km from the epicenter, where many people rushed into the
streets alarmed by the vibrations felt in the buildings. More than 400 people
required attention due to nervousness or anxiety, and two fatalities were
reported due to heart attacks. The electric power was interrupted in some
sectors of the city. The conventional telephone service was sporadically
interrupted as well as the cellular phone service, but both were completely
reestablished fifteen minutes later. Many pipe breaks and leaks were reported in
Mťxico City.
Puebla City, located approximately 125 km from the June 15 epicenter,
has a population of about 5 million and is home to more than 2,000 churches and
temples. More than 100 of these structures were damaged by the seismic events. A
four story building complex located in the downtown area was severely damaged,
in an area where local soil conditions had led to prediction of significant
amplification in earlier microzonation studies. The death toll in this city, the
highest, was five.
In the states of Morelos and Hidalgo the damage was minor and mainly
affected churches and historical monuments built in the 16th and 17th
centuries. In the state of Tlaxcala only one fatality was reported; this due to
a heart attack. The damage here was also minor and consisted of small landslides
along road cuts, cracking of the old churches and houses, and a fire in a
textile factory that resulted in one injury.
In the area investigated by the authors the most notable effects were
concentrated in unreinforced masonry (URM) structures, such as churches and
small adobe and cane houses, of which more than 7,000 were damaged.
The towns in the area surrounding the rupture plane are mostly small
agricultural and mining towns where the damage was concentrated predominantly in
URM structures, such as churches, houses, and rock walls. The bigger towns of
TehuacŠn, the closest to the epicenter, and AcatlŠn de Osorio, located
approximately 60 km to the east of the epicenter, were affected in a similar
manner.
According to the Attorney General of the State of Puebla, Carlos
Arredondo Contreras, there were 15 fatalities due to the first event. The second
earthquake caused no deaths. Table 1.1 presents the summary of damage induced by
the earthquakes of June 15 and June 21, detailed per state.
TABLE 1.1 Summary of the damage in each state caused
by the seismic events of June 15 and June 21, 1999.
| State |
Damaged Houses
|
Deaths |
Injuries |
| Distrito Federal |
Unreported |
2 |
Unreported |
| Guerrero |
Unreported |
1 |
Unreported |
| Oaxaca |
3,476 |
Unreported |
Unreported |
| Puebla |
4,299 |
15 |
188 |
| Tlaxcala |
Unreported |
1 |
1 |
| Veracruz |
70 |
2 |
5 |
A research team consisting of graduate students and faculty from the
University of California at Berkeley (
UCB)
and the National Autonomous University of Mťxico (
UNAM)
performed a preliminary field investigation of seismic geotechnical issues under
the sponsorship of the National Science Foundation (
NSF)
and the Pacific Earthquake Engineering Research Center (
PEER).
In Figure 1.2, the route followed by the research team is shown, with points of
interest and strong-motion stations indicated.
SEISMOLOGICAL AND GEOLOGICAL OBSERVATIONS
According to the National Seismological Service of Mťxico (SSN),
the focus of the seismic event registered on June 15, 1999, was located at
18.20į north latitude and 97.47į west longitude at a depth of 92 km. The
epicenter was calculated at 30 km south southeast of the city of TehuacŠn in the
state of Puebla, approximately 55 km northeast of the city of Huajuapan de Leůn
in the state of Oaxaca. The United States Geological Survey (USGS) located the
epicenter at 18.40į north latitude and 97.45į west longitude at a depth of 71
km. This discrepancy between SSN and USGS data made determining the distance to
the rupture surface for attenuation calculations difficult.
A second strong event with a moment magnitude of 6.3 (USGS) occurred
on June 21 at 12:43 hours (17:43 GMT). According to SSN the focus was located at
18.09į north latitude and 101.78į west longitude at a depth of 42 km. The USGS
published data locating the second event at 18.34į north latitude and 101.49į
west longitude with a depth of 50 km.
The June 15 event occurred in a complex region of normal and reverse
faults with a regional tectonic mechanism associated with the subduction of the
Cocos plate under the North American plate. The Cocos plate moves towards the
northeast and subsides under the Pacific Coast of Mťxico, producing events like
the September 19, 1985, earthquake that caused significant damage in Mťxico
City. This plate subduction also leads to the formation of the Trans-Mexican
Volcanic Belt.
The hypocenter determined by the USGS was used to locate the
hypocenter-to-site (i.e. source-to-site) distance of the June 15, 1999 event.
The rapid moment-tensor solutions for this earthquake suggest that this event
was complex, consisting of two sub-events, separated by several seconds (e.g. <http://wwwneic.cr.usgs.gov/neis/FM/previous/9906.html>).
The fault mechanism was that of a normal fault. The strike of the potential
rupture plane was approximately 310 degrees and dipped to the east or west at
about 45 degrees. This type of fault rupture mechanism is not unusual for this
area of Central Mexico.
The following regional geology descriptions correspond to the central
and southern portions of the state of Puebla that were surveyed by the research
team. The central region, in which Puebla City is located, can be characterized
by the predominance of relatively young (upper tertiary and quaternary) volcanic
structures of diverse types and textures such as basaltic flows, tuffs and ashes
created successively by many volcanoes during the Cenozoic period. The southern
portion of the state, in which the June 15 focus was located, and in which the
cities of TehuacŠn and AcatlŠn de Osorio are located, is composed of a
combination of metamorphic, igneous and sedimentary rocks affected by intense
erosion. The structure of this zone is characterized by normal and reverse
faulting with a predominant northwest strike and a predominant dip toward the
northeast.
STRONG GROUND MOTION
3.1 Attenuation Relationships:
The Mw= 7.0 event on June 15, 1999, in central Mťxico,
generated a number of strong-motion recordings over a variety of geologic site
conditions, including free-field soil and rock as well as motions from various
instrumented structures. Attenuation of the horizontal Peak Ground Acceleration
(PGA) with distance, shown in Figure 3.1, was developed using 18 rock, 2
transition/soil, and 9 soil site recordings at strong-motion stations located
throughout the affected region. This information was provided by UNAM, the
Autonomous University of Puebla (BUAP), and the National Center for Disaster
Prevention of Mťxico (CENAPRED), as
shown in Table 3.1.
The rock sites on which the strong-motion recording stations are
located correspond to 1997 Unified Building Code (UBC) Site Classes B-C, with
most rock sites appearing to be soft and weathered rock (UBC Site Class C). The
soil sites correspond to UBC Site Classes C-D, with most soil sites being UBC
Site Class D.
Table 3.1 Strong-motion data for the June 15, 1999, earthquake.
|
Station |
Organization |
Site Type |
Hypocentral
Distance
(km) |
MHA1
(g) |
MHA2
(g) |
MVA
(g) |
|
CAIG |
SSN |
ROCK |
354 |
0.004 |
0.004 |
0.004 |
|
CUIG |
SSN |
ROCK |
229 |
0.009 |
0.011 |
0.007 |
|
HUIG |
SSN |
ROCK |
336 |
0.015 |
0.012 |
0.006 |
|
OXIG |
SSN |
ROCK |
182 |
0.029 |
0.032 |
0.017 |
|
PLIG |
SSN |
ROCK |
238 |
0.020 |
0.018 |
0.015 |
|
PNIG |
SSN |
ROCK |
245 |
0.003 |
0.003 |
0.003 |
|
PPIG |
SSN |
ROCK |
166 |
- |
0.046 |
0.036 |
|
TUIG |
SSN |
ROCK |
346 |
0.004 |
0.003 |
0.002 |
|
YAIG |
SSN |
ROCK |
200 |
0.054 |
0.072 |
0.028 |
|
ZIIG |
SSN |
ROCK |
460 |
0.002 |
0.002 |
0.002 |
|
RABOSO |
UNAM |
ROCK |
132 |
0.146 |
0.111 |
0.103 |
|
CHILA |
UNAM |
ROCK |
104 |
0.100 |
0.103 |
0.067 |
|
PHPP |
UNAM |
ROCK |
128 |
0.037 |
0.059 |
0.031 |
|
CUER |
CENAPRED |
ROCK |
226 |
0.044 |
0.046 |
0.018 |
|
PBPP |
BUAP |
ROCK |
131 |
0.126 |
0.104 |
0.065 |
|
BHPP |
BUAP |
ROCK |
136 |
0.060 |
0.059 |
0.034 |
|
CUP5 |
UNAM |
ROCK |
229 |
0.012 |
0.012 |
0.008 |
|
ACPD |
UNAM |
ROCK |
327 |
0.005 |
0.005 |
0.003 |
|
DFRO |
UNAM |
TRANSITION |
232 |
0.028 |
0.029 |
0.014 |
|
PENR |
UNAM |
TRANSITION |
217 |
0.031 |
0.028 |
0.023 |
|
PHPU |
UNAM |
SOIL |
128 |
0.106 |
0.284 |
0.057 |
|
SRPU |
BUAP |
SOIL |
130 |
0.220 |
0.134 |
0.073 |
|
CAPP |
BUAP |
SOIL |
132 |
0.105 |
0.074 |
0.046 |
|
UAPP |
BUAP |
SOIL |
128 |
0.111 |
0.097 |
0.066 |
|
CUT2 |
UNAM |
SOIL |
295 |
0.011 |
- |
- |
|
PCJR |
UNAM |
SOIL |
229 |
0.024 |
0.028 |
0.010 |
|
SCT2 |
UNAM |
SOIL |
229 |
0.030 |
0.031 |
0.013 |
|
TLHB |
UNAM |
SOIL |
211 |
0.023 |
0.026 |
0.017 |
|
ACAD |
UNAM |
SOIL |
327 |
0.023 |
0.025 |
0.011 |
|
BUAP: Autonomous University of Puebla |
|
CENAPRED: National Center for the
Prevention of Disasters |
|
SSN: National Seismological Service of
Mexico |
|
UNAM: National Autonomous University of
Mexico |
A series of North American attenuation relationships were plotted
with the collected ground motion data. The Toro et al. (1997) Central and
Eastern North America "Gulf" hard rock attenuation relationship appeared to
represent the trends of the recorded data well, although the PGA values were
slightly underestimated by this hard rock relationship. It is important to
clarify that this attenuation relationship was defined for hard rock with an
average shear wave velocity of 1800 m/s at the surface (i.e. UBC Site Class A)
and uses the Joyner-Boore definitions of distance.
Figure 3.1a and
Figure 3.1b
show the Youngs et al. (1997) intraslab attenuation relationship for rock (UBC,
Type B) and soil (UBC, Types C and D) sites respectively, which is consistent
with the conditions encountered at the ground motion stations. This attenuation
relationship was developed for intraslab earthquakes associated with subduction
zones using data that includes, among many others, the 1973 Mexican event listed
in Table 3.2 as well as other Central Mexico earthquake events. The distance
parameter used by this attenuation relationship is closest distance to the
rupture, however, Youngs et al.(1997) do use hypocentral distance when the fault
plane geometry is not available. Hypocentral distance was used in lieu of the
distance to the rupture, as the rupture plane geometry had not been clearly
defined for the June 15 event at the time of this report. This substitution is
consistent with Youngs et al. (1997) and is not considered to introduce a
significant error due to the great source-to-site distance of the recordings.
As shown in Figure 3.1, recorded peak horizontal accelerations were
significantly higher on "soil" sites that on "rock" sites, and the highest
recorded mean PGA was 0.28 g at the PHPU soil site.
3.2 Site Effects in Puebla City:
The geologic configuration of Puebla City according to Ruiz and
Juarez (1996), is presented in Figure 3.2. The following basic structures can be
differentiated:
a) Very fractured limestone (Kc) geologic units of 20 cm in
thickness appear in the southern limit of Puebla City.
b) Basaltic lava (Qbt), frequently covered by lime-sandy tuff of
yellowish color, generally compact, occurs in the hills to the south
(Tepozochittl and Tolttepec) and to the east of the city, as well as in the
hills of Loreto and Guadalupe.
c) Basaltic clinker (Qc) located in the northwestern portion of the
city and a volcanic cone formed by basaltic clinker of reddish color.
d) Interstratified volcanic tuff with deposits of fluvio-lacustrine
origin (Qtl) that transitions from clays to even-rolling stones appear randomly
distributed around the city.
e) Deposits of travertine (Ql), a banded, very dense material
deposited by calcite springs, are located in the zone of Rancho Colorado, in the
surroundings of Cerro de la Paz, in the bathing Resort of Agua Azul and in the
Historical Center. These deposits happen to occur at different depths and in
strata of variable thickness.
f) Alluvial deposits (Qal), mainly composed of muddy sands, appear
along the Alseseca, San Francisco, and Atoyac rivers.
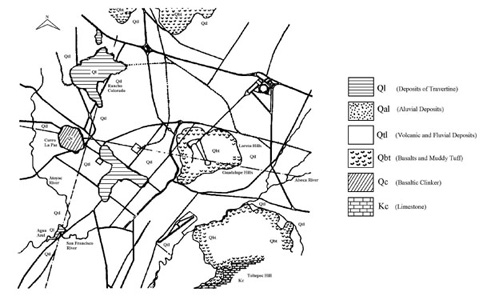
Figure 3.2 Geology map of the City of Puebla (modified from Ruiz and
Juarez, 1996).
3.3
Microzonation of Puebla City:
Puebla City has a long history of seismic events in part because its
proximity to the Trans-Mexican Volcanic Belt. An overview of the frequency of
significant ground motions in the region is presented in Table 3.2. Due to
Puebla’s seismic history, considerable effort has been focused on developing a
microzonation of Puebla City (ChŠvez-GarcŪa et al., 1995). Ruiz and Juarez
(1996), proposed the seismic microzonation map shown in Figure 3.3, based on
analysis of microtremor data using Nakamura’s (1989) technique, and small
refraction studies.
Table 3.2 Historic Seismicity of the city of Puebla,
Ruiz & Juarez (1996), after Figueroa (1974).
| Date
|
Magnitude
|
Modified
Mercalli Intensity |
| 25-08-1611
|
7.5
|
VI
|
| 30-07-1667
|
7.0
|
VII
|
| 16-08-1711
|
7.5
|
VIII
|
| 22-11-1837
|
6.5
|
VI
|
| 03-03-1845
|
6.0
|
VII
|
| 03-10-1864
|
7.0
|
IX
|
| 19-07-1882
|
7.5
|
VII
|
| 24-05-1959
|
6.8
|
VII
|
| 28-08-1973
|
7.0
|
VIII
|
According to this microzonation, four zones can be differentiated.
Zone I considered rock and shallow firm soil (limestones and basalts) with low
predominant period, Tp, around 0.1 to 0.3 seconds. Zone II consists
of travertine outcrops. In Zone III where surficial units consist of alluvial
deposits and volcanic tuff, with Tp around 0.8s, in which
ChŠvez-GarcŪa et al. (1995) found a potential amplification factor of up to 10
based on microtremor results. Zone IV consists of compressible soils, with Tp
of up to 2.5s. The largest values of Tp (2 to 2.5s) appear to the NE,
in sands and silts. In the basalt outcrop this value decreases to 0.1s. On
average, Tp is smaller in tuffs than that of the mixtures of tuff and
alluvial deposits.
3.4 Effects of the June 15, 1999, Earthquake on the City of Puebla:
The June 15 event occurred about 125 km to the southwest of Puebla
City. Even though 8 strong motion instruments exist in the city (see Figure 3.3)
the motion only registered on 6 of them; BHPP (Barranca Honda), CAPP (Central de
Abasto), PBPP (Paseo Nicolas Bravo), PHPU (Parque la Habana), SRPU (San Ramon
Castillotla) and UAPP (Zona Universitaria) as shown in Table 3.3.
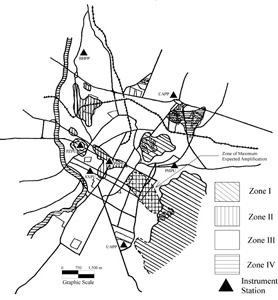
Figure 3.3 Microzonation of Puebla City (after Ruiz and Juarez, 1996)
and
Location of
Strong Ground Motion Stations
The maximum accelerations recorded were 0.28g and 0.22g, registered in
the PHPU and the SRPU strong motion instruments, respectively. The instrument
BHPP located in rock registered 0.06 g. Figure 3.4 shows the baseline corrected
acceleration-time history and corresponding acceleration response spectrum
registered at the PHPU station (soft tuff), and the acceleration-time history
registered at the BHPP station, which is located on basaltic rock. It can be
seen that the excitation energy of the soil record is concentrated around a
period of 0.8 to 1.2 seconds (with a predominant period, T
p, of 0.85
seconds). According to the microzonation, the predominant period of the ground
is around 0.8 seconds or larger, and this correlation of periods could explain
why the major effects of the earthquake were localized in the downtown zone.
When compared to neighboring rock station recordings, significant site
amplification (PGA
soil /PGA
rock of about 4 using the PHPU
and BHPP stations respectively; AlcŠntara et al., 1999) was observed in the City
of Puebla.
Table 3.3 MHA and Duration registered in Puebla City
Strong-Motion Instruments System.
|
Station |
Location |
Site
Type |
Latitude |
Longitude |
MHA1
(g) |
MHA2
(g) |
MVA
(g) |
| BHPP
|
Barranca Honda
|
Basaltic Rock
|
19.109
|
-98.227
|
0.06
|
0.06
|
0.03
|
| CAPP
|
Central de Abastos
|
Compressible Soil
|
19.089
|
-98.188
|
0.11
|
0.07
|
-0.05
|
| PBPP
|
Paseo Nicolas Bravo
|
Medium Compressible
Soil |
19.046
|
-98.208
|
0.13
|
0.10
|
0.07
|
| PHPU
|
Parque la Habana
|
Tuff interlayered
with alluvium ? |
19.040
|
-98.167
|
0.11
|
0.28
|
0.06
|
| SRPU
|
San Ramon
Castillolta |
Basalt and silty
Tuff ? |
18.965
|
-98.260
|
0.22
|
0.13
|
0.07
|
| UAPP
|
Zona Universitaria
|
Low Compressible
soil |
19.002
|
-98.202
|
0.11
|
0.10
|
0.07
|
The baseline corrected acceleration, velocity, and displacement time
history for the motion recorded in the PHPU ground motion instrument is
presented in Figure 3.5. Preliminary analysis shows that the significant
duration, D5-95, of the PHPU soil record was
about 38 seconds. The ratio of PGV/PGA was around 83 cm/s/g at the PHPU site.
The site amplification of the intensity of ground motions along with the
relatively long duration and periodic nature of the motion may help explain the
concentration of damage in Puebla. The ground shaking in Puebla, which is
located at an epicentral distance of about 125 km, was sufficient to cause
damage to old colonial structures, such as churches, and houses constructed
without any structural reinforcement. The ground shaking also adversely affected
some medium-height modern buildings (4 to 5 stories). Most of the damage was
moderate, although 3 buildings collapsed in downtown Puebla.
 5%
Damping Tp = 0.85 s
5%
Damping Tp = 0.85 s
 PUEBLA –
PHPU – N00W
PUEBLA –
PHPU – N00W
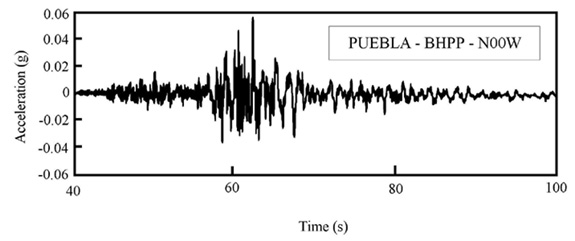
Figure 3.4 Acceleration response spectrum and acceleration-time
history
for PUEBLA-PHPU station (soft tuff) and acceleration-time history for
PUEBLA-BHPP (rock).

D5-95 = 38.4 s, Tp = 0.85 s
PGV/PGA = 83.3 cm/s/g
Component, N00E

Figure 3.5 Acceleration, Velocity, and Displacement time histories
registered at Parque la Habana station, Puebla, during the June 15, 1999
Earthquake.
Site effects were also observed in AcatlŠn de Osorio, a town located
approximately 50 km west of the epicenter, which suffered a substantial amount
of damage. In Mťxico City, located around 200 km from Puebla City, shaking
levels were low, but clear site effects were observed. Figure 3.6 shows the
uncorrected acceleration time history recorded at the Secretaria de
Comunicaciones y Transportes, SCT (located on soft clay) and UNAM (located on
rock) strong ground motion instrument. Amplification of accelerations by a
factor of about 3 can be observed, as can the clearly longer-period nature of
the motions at the soft clay site.
Figure 3.6 Acceleration time histories registered at Mexico City SCT
(soft clay)
and UNAM (rock) stations during the June, 1999 Earthquake.
OTHER GEOTECHNICAL CONSIDERATIONS
The geotechnical considerations presented hereafter correspond
principally to the damage observed by the reconnaissance team at sites along and
near the roads that connect the cities of Puebla, TehuacŠn, Huajuapan de Leůn,
AcatlŠn de Osorio, Izucar de Matamoros, Atlixco, Tepexi de RodrŪguez, San Juan
de IxcaquŪxtla and Huamantla, as is shown in Figure 1.2, as well as a limited
number of reports /observations made by others.
4.1 Effects of Ground Motions on Some Structures:
Collapse of a four-story building, shown in Figure 4.1, occurred in
downtown Puebla. The collapse of this structure may be attributed, in part, to
local soil conditions and site amplification as discussed in Section 3.4. An
adjacent building was severely affected as well, as shown in Figure 4.2. This
structure had a street level garage that collapsed due to column shear;
apparently no punching or settlement occurred. These buildings are located in
the double hatched portion of the microzonation map (Figure 3.3) for which
significant amplification of ground motion was predicted. They are also located
within 1 km of the PHPU station that recorded amplified ground motions in
Puebla. These buildings were part of a four building, four story complex of
which two were completely leveled, one was sheared without collapse, and the
remaining building showed little damage. No one was killed in these buildings.

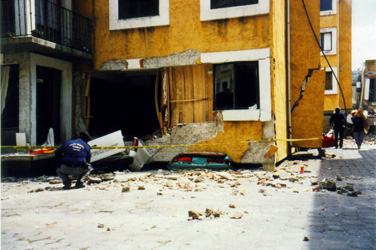
Figure 4.1 Collapse of a four story structure in downtown Puebla in the
zone of predicted maximum amplification.
Figure 4.2 Adjacent to structure in Figure 4.1, this building apparently
collapsed due to column shear and/or buckling, not foundation punching or
settlement.
Figure 4.3 shows a 5 m deep, unbraced open excavation for the placement
of a sewer line. This site is also located in the double hatched zone on the
microzonation map, but did not show any evidence of failure or displacement. At
the time of the June 15 earthquake, workers were inside the excavation.
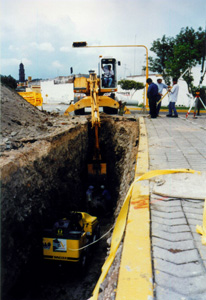
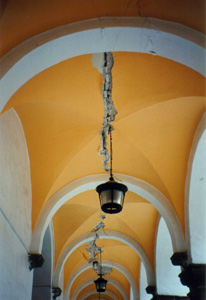
Figure 4.3 Unaffected 5 m deep open excavation in Puebla City.
Figure 4.4 Cracked dome arches in the old Carolino building, downtown
Puebla City.
Old structures were particularly hard hit during the events of June 15
and June 21. Figure 4.4 shows the Carolino building of downtown Puebla. The
interior structural damage seen is indicative of damage that most URM structures
in the Puebla and Oaxaca regions experienced. Figures 4.5 and 4.6 show the
typical damage that many of the churches in the affected region experienced. In
nearly every town, regardless of how small the population is, there is a church
similar to the churches seen in these two figures. With unerring regularity,
these churches were damaged during the strong ground shaking. Even in the towns
least affected by the tremors, where all other structures emerged unscathed, the
churches often had some sort of damage.
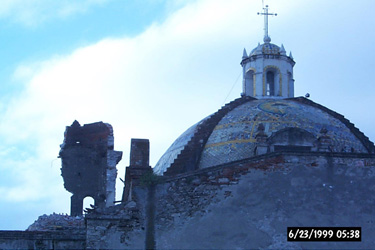

Figure 4.5 Collapsed Tower of Saint Augustine church, Puebla City.
Together with the Municipal Palace, this was on of the most affected old
structures.
Figure 4.6 Cracked church dome in AcatlŠn de Osorio, typical of observed
damage.
An interesting example of "local site effects" is the damage to the
church in the town of Cholula, approximately 10 km west of Puebla City. Figures
4.7 and 4.8 show the damage that occurred to this 16
th century church
that is built on an ancient stone pyramid. The severe damage may be attributed,
at least in part, to topographic amplification of ground motions due to the
pyramid.

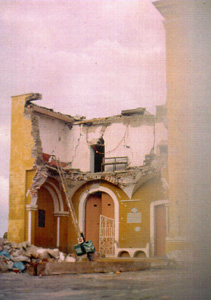
Figure 4.7 Church in Cholula founded on the top of an ancient stone
pyramid.
Figure 4.8 Damage to the Cholula church due, in part, to topographic
amplification of ground motions.
The most severely affected town that the authors visited was Acatl
Šn
de Osorio, located approximately 50 km west of the June 15 epicenter. Site
effects were prominent in this town, with the most damage occurring to
structures in the sediment filled valley and little or no damage to the
structures located on rock in the foothills. Figure 4.9 shows the type of damage
that was common in the downtown region. On certain streets many houses were
reduced to rubble such as the one shown. Figure 4.10 shows a relatively modern
two-story structure that was destroyed.
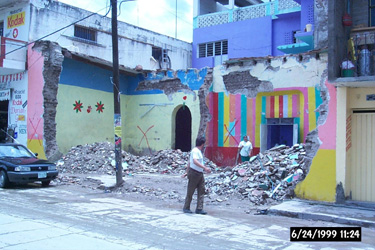
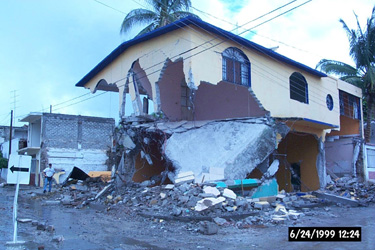
Figure 4.9 Demolished URM structure in AcatlŠn de Osorio.
Figure 4.10 Damaged modern reinforced concrete structure in AcatlŠn de
Osorio.
Damage to a bridge, shown in Figures 4.11 and 4.12, was observed on
Highway 135 north of TehuacŠn. Four bridges are located within 3 km of each
other along this stretch of highway. The only bridge to be structurally damaged
was one supported by three columns. This bridge experienced 15 cm of
displacement in the lateral and longitudinal directions. Settlement of the
approach embankments was identified by large tension cracks in the embankment
shoulders. The three nearby undamaged two column bridges had the same
orientation and were located in similar topography, yet experienced negligible
damage.
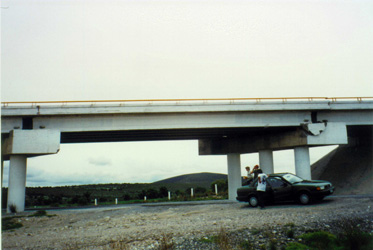
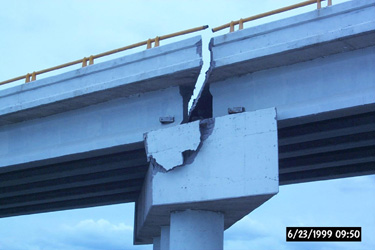
Figure 4.11 Damaged bridge on Highway 135 north of TehuacŠn.
Figure 4.12 This three column bridge experienced both lateral and
longitudinal displacement.
4.2 Landslides:
Figure 4.13 shows shallow landsliding that occurred on the slopes of
Cerro el Pinal. Larger landslides occurred on the flanks of the extinct volcano,
Cerro la Malinche. These slides damaged the aqueduct that supplies water to the
town of Ixtenco in the State of Tlaxcala, effectively cutting off the water
supply for several days.
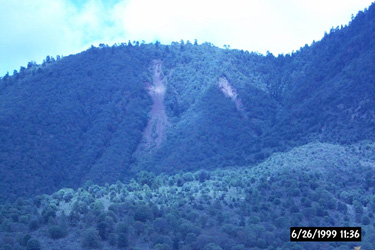
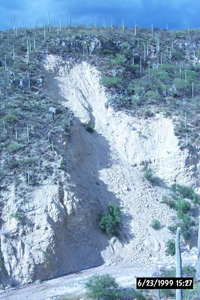
Figure 4.13 Landslide scars on Cerro el Pinal. Similar landslides on
Cerro la Malinche disrupted an aqueduct that supplied water to surrounding
towns.
Figure 4.14 Reactivated landslide on the road from TehuacŠn to Huajuapan
de Leon.
A series of small rock falls occurred along road cuts in the proximity
of TehuacŠn. Small slides were common along the cut slopes adjacent to roads in
the vicinity of the epicenter. These failures included rockslides, rock
toppling, block sliding of both earth and rock, and surficial raveling. In the
states of Puebla and Oaxaca, sliding deposited debris on the roadways causing
traffic delays and road closures. Figure 4.14 shows a larger reactivated slide
located on the route from TehuacŠn to Huajuapan de Leůn. Figure 4.15 shows
tension cracks parallel to the mountainous road that extends from the city of
AcatlŠn de Osorio to Izucar de Matamoros.
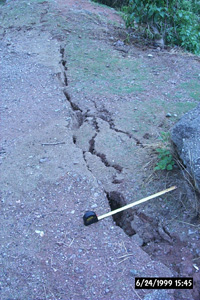
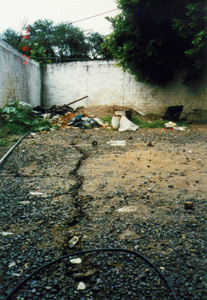
Figure 4.15 Slumping and cracking of soil near a steep slope adjacent to
the highway at Puerto el Gato.
Figure 4.16 Lateral extension cracks in soil, AcatlŠn de Osorio.
4.3
Ground Failure:
Surface expression of fault rupture was not seen along the path
followed by the reconnaissance team. Lateral cracks in the earth, not associated
with surface rupture, were observed in the backyard of a house in the city of
AcatlŠn de Osorio in the state of Puebla, as shown in Figure 4.16. These
appeared to be related to poor performance of relatively loose surficial soil or
fill.
4.4 Soil Liquefaction:
Liquefaction occurred in the highlands ("altiplano") of the State of
Tlaxcala, about 20 km northwest of the City of Puebla. Sand boils, shown in
Figure 4.17, were observed throughout a large area in a cornfield. The liquefied
soil was volcanic in origin, a non-plastic silty sand with 28% passing the #200
sieve. There were no observations of significant soil liquefaction affecting
structures, which is not surprising given the dry season and relatively moderate
levels of shaking. Several cases of poor structural performance, apparently due
to cyclic densification/settlement of loose surficial soils or fills were noted.
 Figure 4.17
 Sand boil in volcanic non-plastic silty sand, located in a
corn field 20 km northwest of Puebla.
4.6 Miscellaneous:
According to the Red Cross, 35
people were trapped and one died in a mine at San Antonio Atexcac, in the State
of Veracruz. In TehuacŠn, another report claims that several people were trapped
in a quarry due to a landslide. Many schools reported damage, but the authors
saw very little in the way of geotechnical or structural related issues
associated with these reports.
ACKNOWLEDGMENTS
The authors would like to extend their thanks to the National Science
Foundation and the Pacific Earthquake Engineering Research Center for funding
the reconnaissance trip. Special thanks to Dr. Cliff Astill, Dr. Jack Moehle,
Dr. Sergio Alcocer, Dr. Mario Ordaz, Dr. Douglas Dreger, Dr. Lind Gee, Dr. Raķl
Castro, Dr. Walt Silva, Dr. Gabriel Toro, Joe Whartman, Gerardo Aguilar,
Francisco HernŠndez, Oswaldo Flores, Loren Bedolla, Helmuth Lau, Guillermo
GonzŠlez, Alberto Altamirano, Guillermo Melgarejo, Carlos HernŠndez, and Liliana
RamŪrez for their contributions and assistance.
REFERENCES
- Aguirre et al. (1999) "Reporte Preliminar del Temblor de TehuacŠn,
Puebla, del 15 de Junio de 1999 (M = 6.7)." Aspectos Sismolůgicos y de
Movimientos Fuertes. Unpublished.
- AlcŠntara et al. (1999) "El Temblor de TehuacŠn, Puebla del 15 de junio
de 1999 (M=6.7) registrado por lared de Acelerografos de la Ciudad de Puebla
(RACP)." UNAM internal report, RACP-II/BUAP-04, June.
- ChŠvez-GarcŪa et al. (1994) "Microzonificaciůn Sismica de la Zona Urbana
de la Ciudad de Puebla." Informe Tťcnico del Instituto de IngenierŪa UNAM,
0996-T9111, Feb.
- ChŠvez-GarcŪa et al. (1995) "Seismic microzonation of the city of
Puebla, Mexico." Third International Conference on Recent Advances in
Geotechnical Earthquake Engineering and Soil Dynamics. Pages 545-548, Vol.
II.
- Figueroa, J. (1974) Sismicidad en Puebla: macrosismo del 28 de agusto de
1973. Instituto de Ingenieria, UNAM, informe No. 343, Mťxico, D.F., Octubre.
- Idriss, I. M. and Sun, J. I. (1992). "SHAKE91: a computer program for
conduction equivalent linear seismic response analyses of horizontally
layered soil deposits." User’s Guide, University of California, Davis, 13 p.
- Instituto Nacional de EstadŪstica, GeografŪa e InformŠtica (INEGI),
Orizaba E14-6.
- International Conference of Building Officials (1997) "Uniform Building
Code: Volume 2 – Structural Engineering Design Provisions," Chap. 16, Div IV
– Earthquake Design.
- La Jornada, Various articles of the editions of June 16 through June 22,
1999.
- Nakamura, Y. (1989) "A method for dynamic characteristics estimation of
subsurface using microtremor on the ground surface." RTR1 30, Number 1, Feb.
- Ruiz, C. and Juarez, J. (1996). "Seismic zonation of Puebla, Mexico."
Proceedings of the Eleventh World Conference on Earthquake Engineering,
Pergamon, Elsevier Science Ltd., Disc 3, Paper No. 1647.
- Toro, G. R., Abrahamson, N. A., and Schneider, J. F. (1997) "Model of
Strong Ground Motions from Earthquakes in Central and Eastern North America:
Best Estimates and Uncertainties." Semoislogical Research Letters,
Seismological Society of America, Volume 68, Number 1, Jan/Feb.
- Youngs, R.R., Chiou, S.-J., Silva, W. J., Humphrey, J. R., (1997)
"Strong Ground Motion Attenuation Relationships for Subduction Zone
Earthquakes." Semoislogical Research Letters, Seismological Society
of America, Volume 68, Number 1, pp. 58-73. Jan/Feb.