KAYNASLI
Figure 1. Map of Kaynasli, showing Highway 100 (in red), selected local streets (in black), location of fault rupture (green), and selected locations referred to below.
Damage Survey
A survey of damage was performed for each of the five zones indicated above. The survey encompassed structures with more than one story along the streets indicated on the map, which were all on the south side of Highway 100. These are not all of the structures in Kaynasli, but comprise a representative sample. Both timber/brick and reinforced concrete buildings were included within the survey. Damage patterns in the two types of construction did not differ significantly. The damage was categorized according to the system of Table 1. The survey results are in Table 2.
Table 1. Structural damage index.
| Index | Description | Interpretation |
| D0 | No Observable Damage | No cracking, broken glass, etc. |
| D1 | Light Damage | Cosmetic cracking, no observable distress to load bearing structural elements |
| D2 | Moderate Damage | Cracking in load bearing elements, but no significant displacements across these cracks |
| D3 | Heavy Damage | Cracking in load bearing elements with significant deformations across the cracks |
| D4 | Partial Collapse | Collapse of a portion of the building in plan view (i.e. a corner, or a wing of building) |
| D5 | Collapse | Collapse of the complete structure or loss of a floor of the structure. |
Table 2. Results of the damage survey.
Zone |
No. Bldgs |
D0 |
D1 |
D2 |
D3 |
D4 |
D5 |
1 |
40 |
64% |
27% |
3% |
3% |
3% |
0 |
2 |
21 |
48% |
37% |
5% |
5% |
0 |
5% |
3 |
45 |
51% |
26% |
7% |
0 |
0 |
16% |
4 |
53 |
4% |
15% |
8% |
13% |
6% |
54% |
5 |
26 |
35% |
30% |
4% |
8% |
0 |
23% |
Total |
185 |
38% |
25% |
5% |
6% |
2% |
24% |
Damage South of Highway 100 (Not on main fault trace)
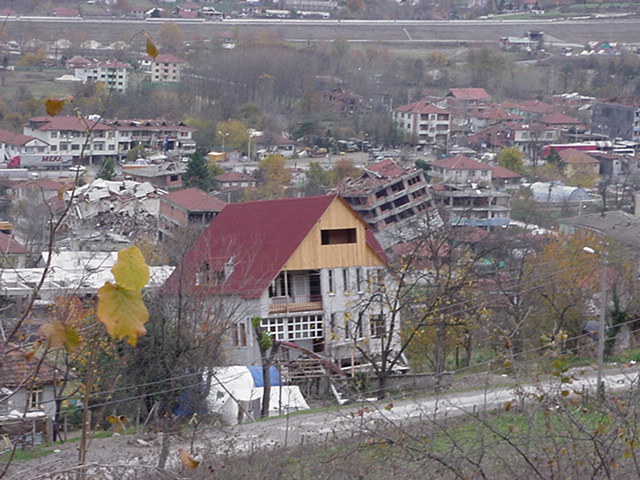
Figure 2. Looking north across heavily damaged central section of Kaynasli, Zone 4 (11/20/1999, N 40.462915, E 31.193062).
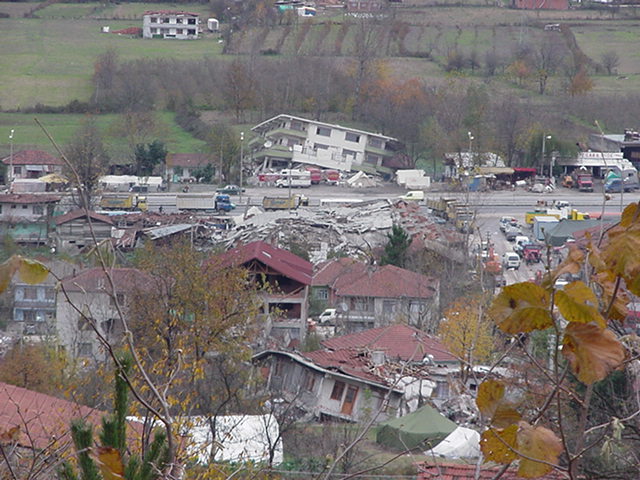
Figure 3. Another view of central section of Kaynasli, Zone 4 (11/20/1999, N 40.462915, E 31.193062).
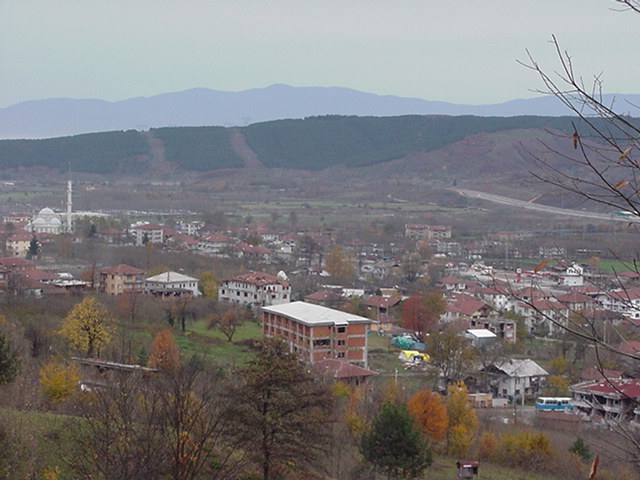
Figure 4. Looking NW across relatively lightly damaged western section of Kaynasli, Zone 3 (11/20/1999, N 40.462915, E 31.193062).
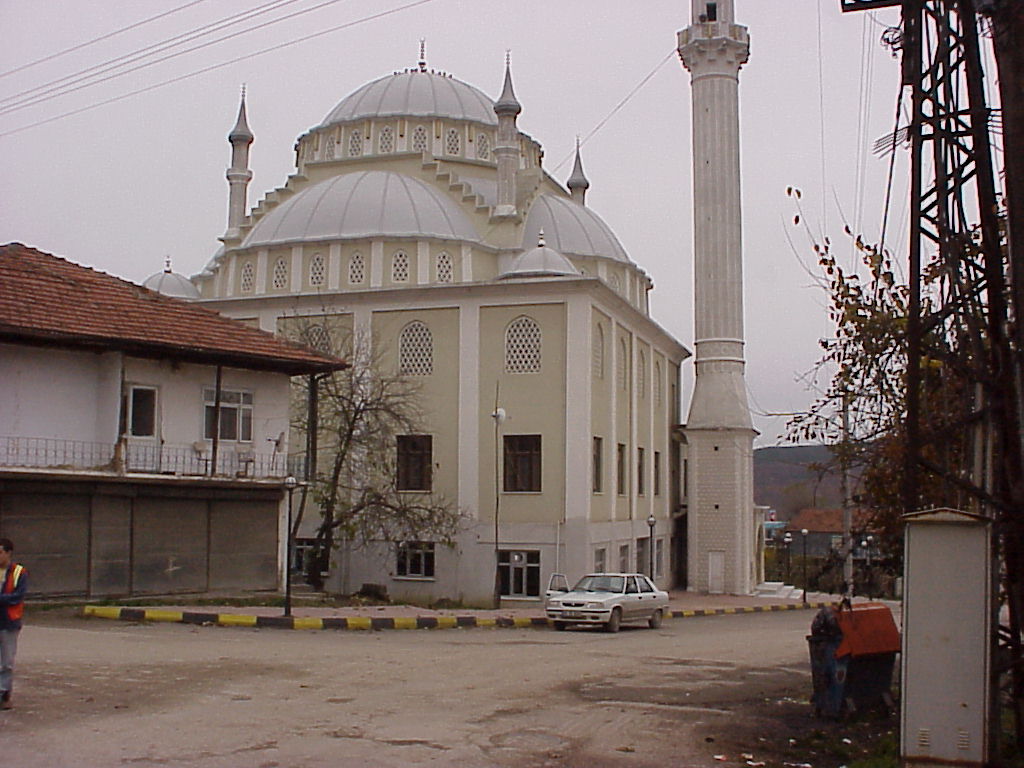
Figure 5. Undamaged mosque in western Kaynasli, Zone 2. This structure is about 200-300 m south of the fault. Damage was light in this section of town (11/20/1999, N 40.465252, E 31.182127).
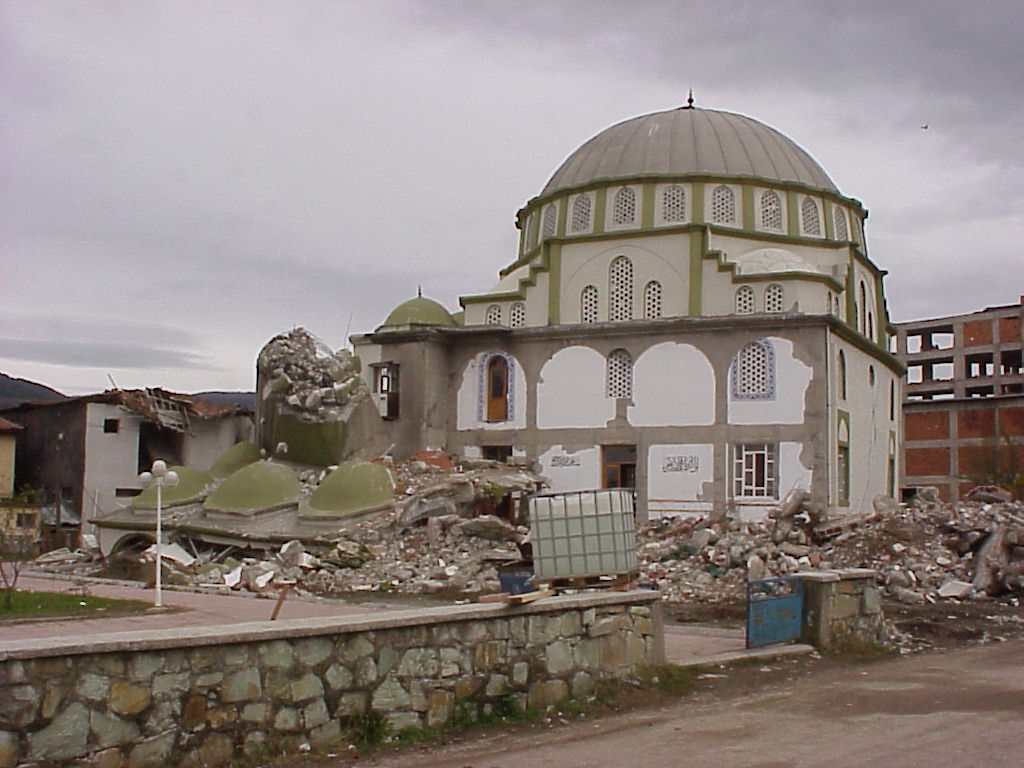
Figure 6. Partially collapsed mosque in central Kaynasli, Zone 4. This structure is about 500 m south of the fault. Damage was severe in this section of town (11/20/1999, 40.463610, 31.190686).
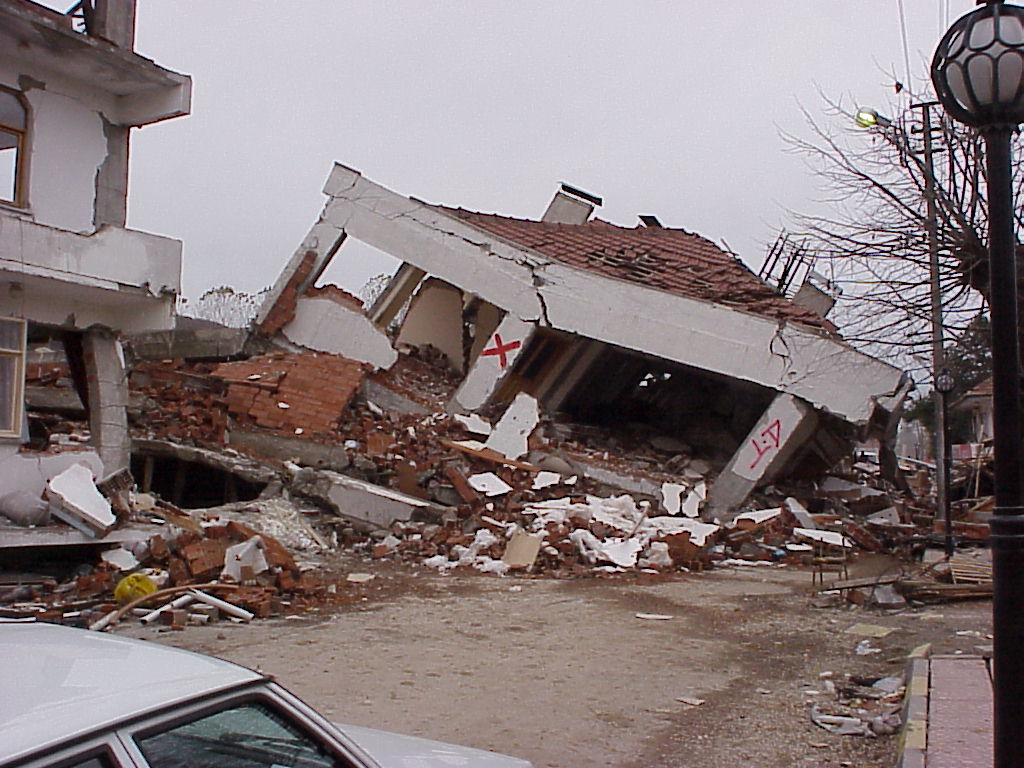
Figure 7. Collapse of typical reinforced concrete building in central Kaynasli, Zone 4 (11/20/1999, N 40.463076, E 31.192260).
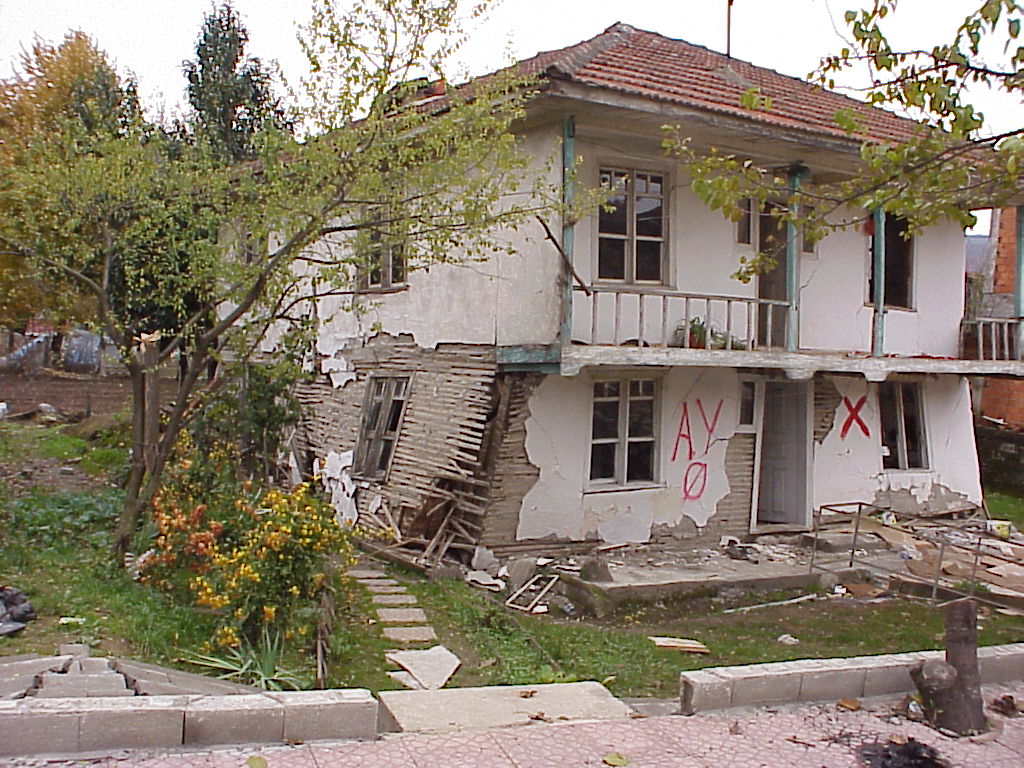
Figure 8. Damage to typical wood-frame dwelling in central Kaynasli, Zone 4 (11/20/1999, N 40.463076, E 31.192260).
Fault Rupture
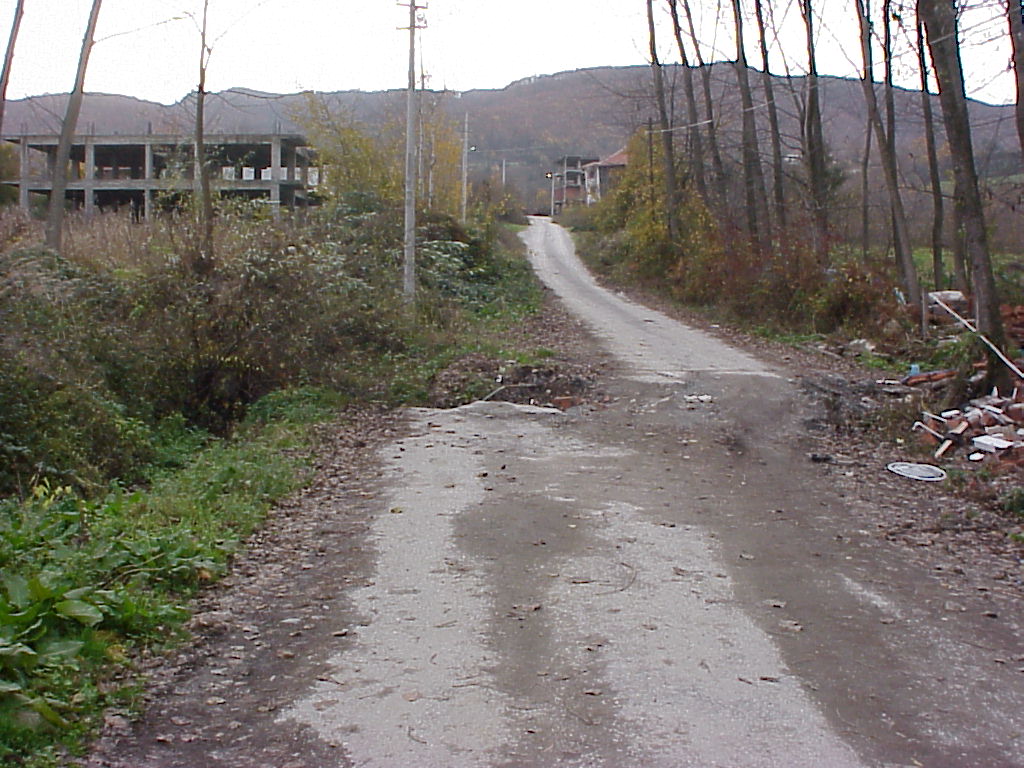
Figure 9. Fault rupture across road in western Kaynasli, right-lateral strike slip displacement was about 4.0 m at this location (11/20/1999, N 40.466610, E 31.177251).
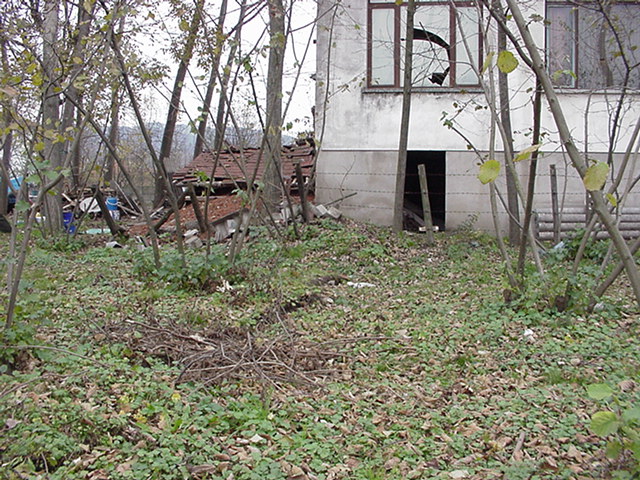
Figure 10. Structure @ WP 53. Fault ruptured beneath foundation, but only minor cracking occurred in structure (11/20/1999, N 40.465757, E 31.180982).
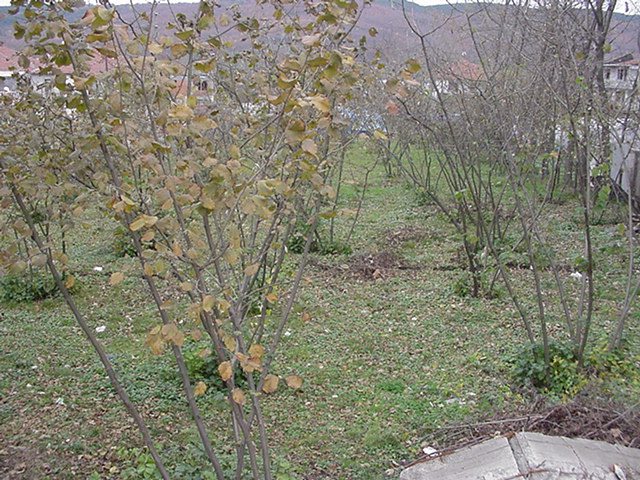
Figure 11. Structure @ WP 153. Approximately 1.0 - 1.3 m of right-lateral offset in trees, directly west of structure (11/20/1999, N 40.465757, E 31.180982).
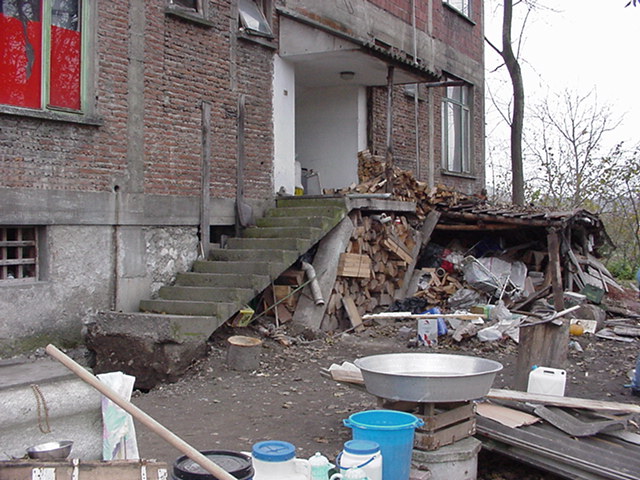
Figure 12. Structure @ WP 153. Fault rupture passes beneath stairs. Columns were displaced, but stairway remained connected to structure. 1 m of offset was measured between base and top of columns. Concrete walkway at base of stairs was pulled away 94 cm (11/20/1999, N 40.465757, E 31.180982)
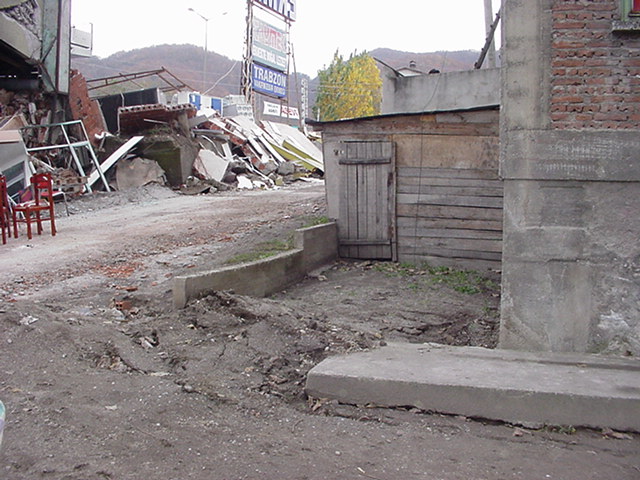
Figure 13. Structure @ WP 153. Walkway displaced 1.1 m from edge of building (11/20/1999, N 40.465757, E 31.180982).
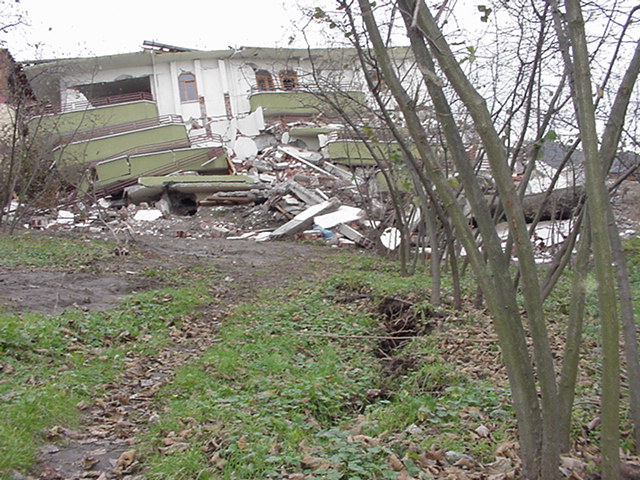
Figure 14. Structure @ WP 155. Fault rupture passing directly beneath foundation. Offset in adjacent bushes is 2 to 3 m. It is unclear whether damage is due to rupture or strong shaking (11/20/1999, N 40.466073, 31.182153).
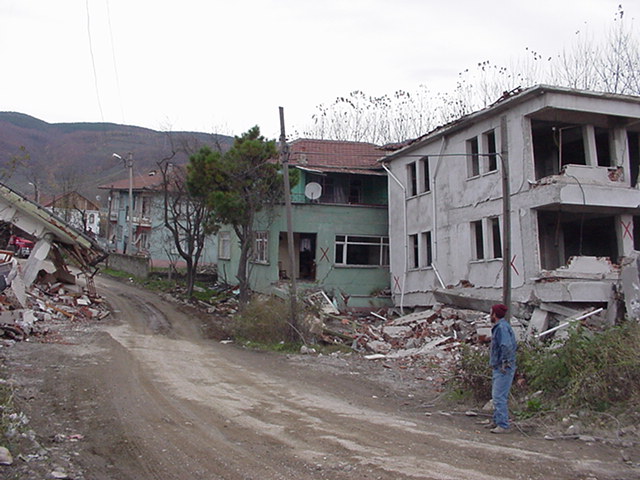
Figure 15. Structures @ WP 156. Three collapsed buildings along the trace of the fault rupture. Undamaged homes in the background showed no distress. Due to regrading of the road, an offset measurement was not possible (11/20/1999, N 40.465979716, E 31.1824304104).
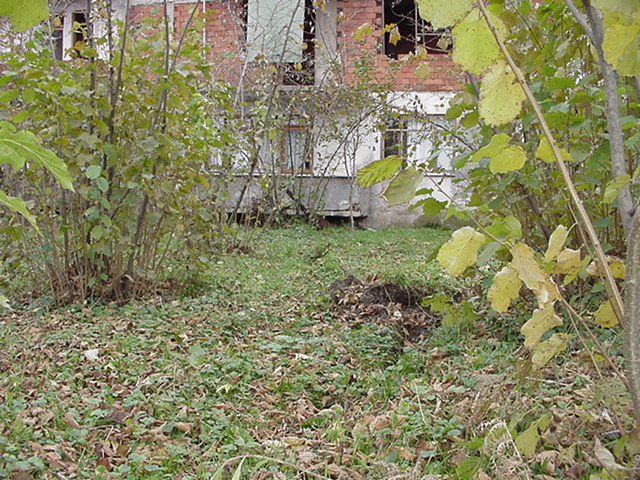
Figure 16. Structure @ WP 160. View of fault rupture entering structure on its west side. Fault rupture caused rotation of the structure. Extension and compression of soil observed around foundation, consistent with clock-wise rotation of foundation (11/20/1999, N 40.465805, E 31.183618).
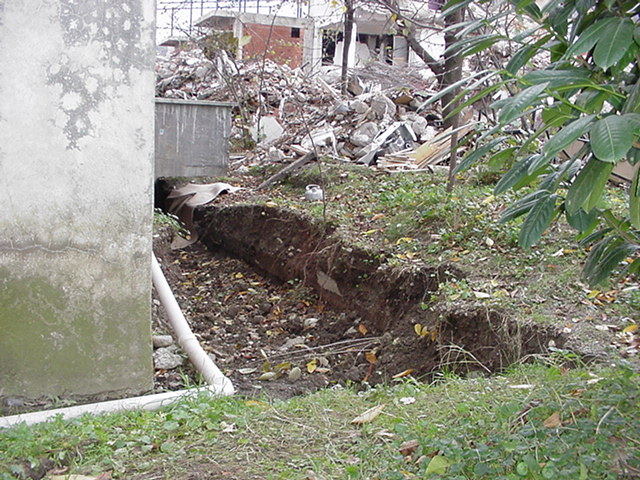
Figure 17. Structure @ WP 160. Extension on south side of building (11/20/1999, N 40.465805, E 31.183618).
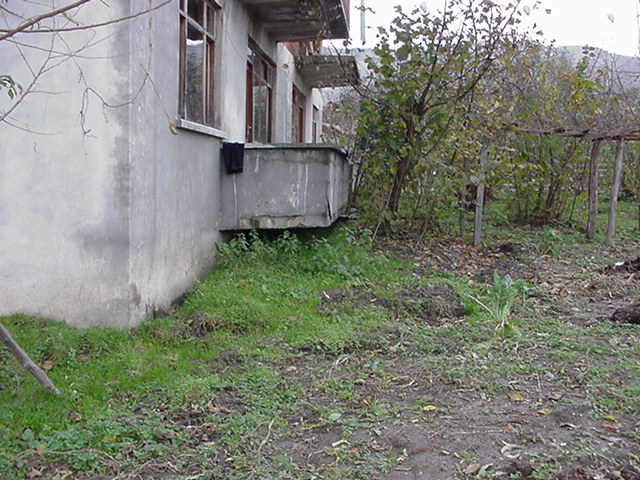
Figure 18. Structure @ WP 160. Slight soil compression on west side of building (11/20/1999, N 40.465805, E 31.183618).
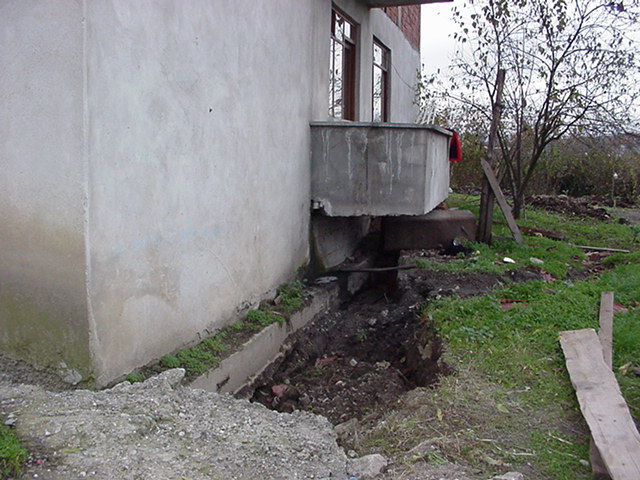
Figure 19. Structure @ WP 160. Extension on north side of building (11/20/1999, N 40.465805, E 31.183618).
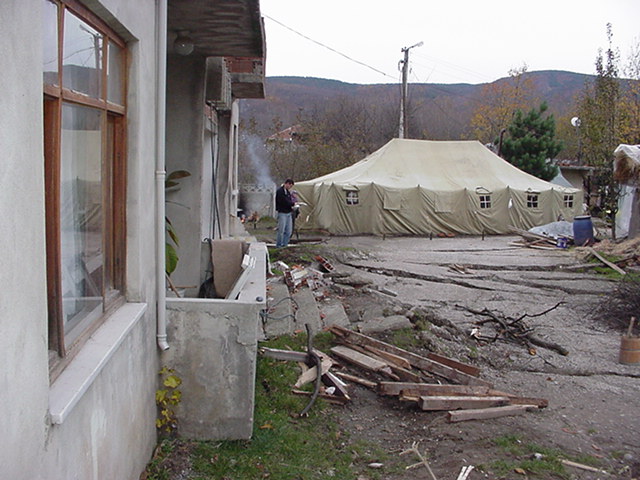
Figure 20. Structure @ WP 160. Passive wedge from foundation pushing into soil on east side of building. Extension cracks indicate a small step over in the fault (11/20/1999, N 40.465805, E 31.183618).
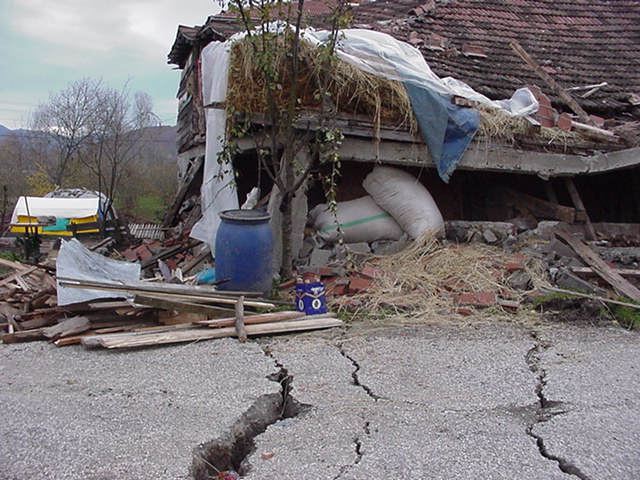
Figure 21. Structure directly east of rotated structure @ WP 160. Columns pulled apart due to extension across building at step over in fault (11/20/1999, N 40.465805, E 31.183618).
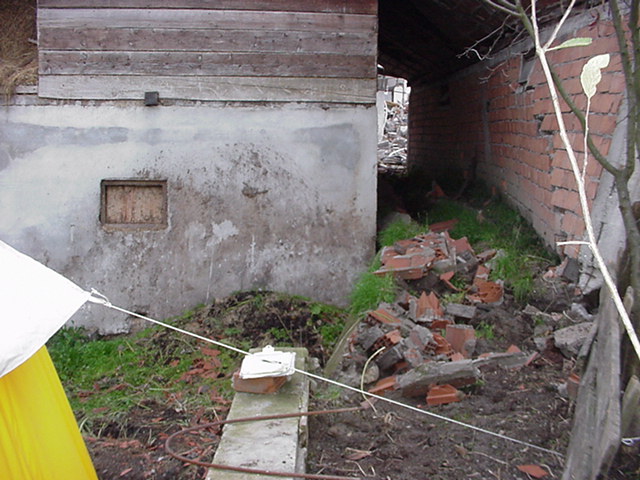
Figure 22. Structure directly east of rotated structure @ WP 160. Fault offset observed through wall on east side of structure (11/20/1999, N 40.465805, E 31.183618).