Preliminary report on the principal seismological and engineering aspects of the Mw = 6.5 Achaia-Ilia (Greece) earthquake on 8 June 2008
ITSAK - Institute of Engineering Seismology and Earthquake Engineering:
Basil Margaris, Christos Papaioannou, and Nikolaos Theodoulidis (Engineering Seismologists); Alexandros Savvaidis (Geophysicist); Nikolaos Klimis and Konstantina Makra (Geotechnical Engineers); Milton Demosthenus; Christos Karakostas, Vassilis Lekidis, Triantafillos Makarios, and Thomas Salonikios (Structural Engineers)
University of Patras, Civil Engineering Department:
George Athanasopoulos, George Mylonakis, Costas Papantonopoulos, Vicky Efthymiadou, Panos Kloukinas, Ivan Ordonez, and Vassilis Vlachakis
University of California, Los Angeles:
Jonathan P. Stewart
Printable pdf Version of Full Report (6.7 MB)
The Achaia-Ilia (Greece) Earthquake occurred on 8 June 2008 at 15:25 local time. Strong shaking of sufficient amplitude to damage structures occurred over a broad area of approximately 2000 square kilometers. The earthquake was reported to have been felt as far away as 350 km from the epicentral area. Moment tensor solutions provided by multiple organizations are quite consistent with respect to focal mechanism (indicating a dextral strike-slip event on a nearly vertical fault) and moment magnitude (6.3-6.5). Subsequent analysis of aftershock distributions reveals the fault strike to be approximately 210 deg on a previously unmapped fault. Preliminary analysis suggests that the fault limits may correspond to NE striking normal faults near the Kato Achaia coastline and Pinios Lake. The mainshock was recorded by 21 strong motion instruments operated by ITSAK and the University of Patras Department of Civil Engineering at distances from the surface projection of the fault ranging from approximately 15 to 350 km. The data are somewhat weaker than predicted by an NGA ground motion prediction equation at short period but are reasonably consistent with predictions for 1.0 sec spectral acceleration.
Surface rupture of the fault has not been observed to date, which is not surprising given the 31 km focal depth for this moderate magnitude event. However, ground failure was widely observed within approximately 15 km of the fault, taking the form of landslides (mostly rockfalls), liquefaction, coastal subsidence, and settlement of fills. Major geotechnical structures in the strongly shaken region include a large dam (Pinios Dam) and several port facilities. All remained functional, although some modest damage was observed at some ports and harbors. Most significant structural damage (sometimes total collapse) occurred in common masonry buildings typically comprised of stone or mudbricks. Brick masonry buildings of cultural importance suffered in general less damage due to their better maintenance conditions. Damage in reinforced concrete buildings was confined mostly to brick infill walls, although one collapse of a 1984 reinforced concrete building with soft ground storey occurred and local damage to R/C elements was observed in some cases.
Web Report Table of Contents:
1.0. Geologic and Seismotectonic Setting
2.0. Seismotectonic and Seismological Information
3.0. Ground Motions
4.0. Search for Surface Fault Rupture
5.0. Landslides and Rockfalls
6.0. Performance of Pinios Dam and Earth Retaining Structures
7.0. Liquefaction and Ground Failure
8.0. Performance of Ports
9.0. Seismic Response of Structures
Tables
Figures
References
Acknowledgments
1.0 Geologic and Seismotectonic Setting
The basic geologic zones of Greece are shown in Figure 1.1. The epicentral area is situated in the Ionian geological zone (marked in yellow, numbered as #II) and is close to its east boundary with the Gavrovo-Tripoli zone (marked in light orange, numbered as #III). In the Ionian zone, the area is covered by an over 2km thick layer of Flysch, the lower part of which consists mainly of marly sandstones-marls and evolves upwards with alternating layers of marls, marly limestones and conglomerates. In the Gavrovo-Tripoli zone, the area is covered by Flysch, which consists mainly of marls. It is estimated that its thickness can attain 2km.
The known structural elements of the area under investigation are shown in Figure 1.2, which are part of the seismotectonic Map of Greece issued by the Institute of Geology and Mineral Exploration (IGME Athens Greece; 1989). The mountain Skollis (Santomeri), where the affected villages Santomeri, Portes and Valmi are located, lies on the Gavrovo-Tripoli zone (green oblong shape striking N-S in Figure 1.2). It should be noted that there are no known major faults coinciding with the strike of the moment tensor solution, or the aftershock distribution which strikes NNE-SSW. Most faults indicated on the map in the meizoseismal area are oriented NS with a small NW deviation and NW-SE, as evident on the map. It is also of interest that no major surface ruptures with this orientation were observed in the field. Note that the specific area is considered, by Greek standards, a medium-seismicity zone. Although some epicenters are shown by the circles in Figure 1.2, we defer discussion of previous seismicity to Chapter 2.
These observations should not come as a surprise: a significant number of destructive earthquakes around the world, including Northridge (1994), Kobe (1995), Grevena-Greece (1995), Athens (1999), have occurred on unmapped and/or blind faults.
[back to table of contents]
2.0 Seismotectonic and Seismological Information
2.1 Regional Seismotectonic Setting
The strong earthquake of June 8, 2008 occurred at NW Peloponnese (Greece) at a distance of about 17 km southwest of the town of Patras on a dextral strike slip fault and is denoted by a red square in the map of Figure 2.1. There are three known historical earthquakes (Papazachos and Papazachou, 2003) related to this fault.
Figure 2.1 shows the plate motions that affect active tectonics in the Aegean and surrounding regions (Papazachos and Papazachou, 2003). The tectonic framework in the broader area is dominated by the large dextral strike slip fault (CTF) off the coasts of Cephalonia Island (Scordilis et al., 1985) at the northwestern part. The CTF defines the north-westernmost boundary of the Aegean plate and the rate of seismic slip in the Cephalonia fault (~3cm/yr) is the highest observed in the whole Aegean area (Papazachos et al., 1994; Papazachos and Kiratzi, 1996). In the western and southern part exists the collision front between the African and the Eurasian plates where the subduction of the African plate is taking place. At the northern part there is the N-S extensional field with the normal faults of the Corinthiakos and Patraikos Gulfs.
The results of the analysis of small magnitude earthquakes recorded in the broader epicentral area during several microseismicity surveys (Hatzfeld et al., 1989, 1993; Karakostas et al., 1994; Rigo et al, 1996) show the existence of numerous normal and strike slip earthquake faults with small length. Hatzfeld et al (1990) estimated the fault plane solutions of microearthquakes in this area and found strike slip motion for events with depths larger than 11 km, which occurred in the northern and central Peloponnese and the area close to Rio.
2.2 Seismological Aspects
The area of Northwestern Peloponnese is characterized by high seismic activity. The map in Figure 2.2 shows the geographical distribution of earthquakes at northwestern Peloponnese. Circles of various size and color were used to represent the various magnitude classes as shown in the legend. Papazachos and Papazachou (2003) reported three (1785 M6.4, 1804 M6.4 and 1806 M6.2) damaging shallow earthquakes with epicenters in the area of the June 8, 2008 earthquake which caused damage to Patras. Table 2.1 gives information on the parameters of these historical earthquakes. According to Papazachos and Papazachou (2003) the errors in the location of the epicenters are of the order of 20 km and for the magnitude is +/- 0.3 magnitude units.
During the instrumental period (after 1900) only one strong (M>6.0) earthquake occurred in the broader area of NW Peloponnese before the last one. This earthquake with magnitude M=6.0 occurred on October 16, 1988 with epicentral coordinates 37.910 degN 21.060 degE, off the north-western coasts of Elia. However earthquakes of moderate (5.2<M<5.6) magnitude which took place during the past decades caused some damage mainly to low quality structures close to the epicentral area. Table 2.1 summarizes the information of these sequences. The data source is the catalogue of the Seismological Station of the Thessaloniki University (http://lemnos.geo.auth.gr).
2.3 The Earthquake of June 8 2008
Identification of potential seismic sources is important for earthquake hazard mitigation. Assuming that earthquakes occur periodically at the same place, seismicity maps, historical catalogs, and maps of active faults are the information used to infer the seismic hazard in a region. The earthquake of June 8, 2008 will probably modify the view of seismic hazard and the location of historical events in the area, where there are critical infrastructures such as dams, lifelines, airport. The original location of this event motivated the deployment of a network of a digital seismological network consisting of broadband accelerometers and velocity meters. The analysis of these data is beyond the scope of this report.
The mainshock of the Achaia-Ilia earthquake sequence occurred at 12:25 on June 8, 2008 with magnitude M=6.5. The location of the mainshock computed by Aristotle University of Thessaloniki (AUTH) using the readings of the national seismological network was 37.944 degN and 21.5438 degE with a depth of 3 km and RMS error 0.67 sec. Due to the lack of stations located close to the epicenter, the accuracy of the location, especially of the depth, is questionable, and it was attempted to relocate the mainshock using phases recorded at the digital accelerographs operated by ITSAK and located at Vartholomio (VAR2) and Zakynthos (ZAK1). Using these phases the final location which adopted is 37.9933 degN and 21.5887 degE with a depth of 31 km and RMS error 0.20 sec.
We used the locations of the earthquake epicenters determined by AUTH for the period immediately after the occurrence of the main shock up to June 18, 2008 with magnitude 3.0<M<5.0 and rms<0.78 sec. These epicenters are plotted in the map of Figure 2.3 and show clearly a lineament striking NNE-SSW.
Several institutions determined the Moment magnitude and the CMT. Table 2.3 summarizes the results as appeared in the home page of EMSC (www.emsc-csem.org) for this earthquake.
Table 2.4 gives information on the source parameters of the aftershocks with M4.0. The data source is the site of the seismological station of the Aristotle University of Thessaloniki.
Based on the results of Table 2.3 it is clear that the earthquake of June 8, 2008 occurred on a dextral strike slip fault. This observation is in excellent agreement with the geographical distribution of the aftershocks. The HRV solution is plotted in Figure 2.3.
If we consider a mean value of MW = 6.4 then based on the scaling relation:
log(L) = 0.51*Mw - 1.85 |
(2.1) |
(Papazachos, 1989) we have a fault length equals to 26 km which is in good agreement with the length of the zone determined by the aftershock distribution and specially the earthquake with M4.0. The fault is bounded to the north by a fault trending WNW-ESE and marked in red. This fault was determined by Doutsos and Poulimenos (1992). At the southern part of the fault there is the Vounagron fault (Koukouvelas et al., 1996), which according to our knowledge is the only mapped fault at the closest proximity to South. However at the southern termination of the fault (around 37.9) there is a structure striking almost E-W and which may be considered as a probable fault. Even though it is not recognized from field observations as a fault there are evidences supporting the idea of a morphotectonic lineament based on the data of elaborated satellite images and the morphological relief map.
A critical issue during a strong earthquake is the estimation of its rupture zone .The rupture zone of an earthquake is usually considered to be the part of the Earth's lithosphere, which is strongly deformed before the earthquake (Benioff, 1955, 1962; Gzovsky, 1962) and that ruptures during the generation of the earthquake. It is also assumed that the foci of aftershocks of a shallow mainshock are due to redistribution of the stress in the rupture zone, caused by the generation of the mainshock, and for this reason the spatial distribution of aftershocks defines the rupture zone of the mainshock (Benioff, 1955; Kiratzi et al., 1985). Papazachos et al., (1997) determined the rupture zones of strong earthquakes in the Aegean area and represent them as ellipses. The white ellipsis in Figure 2.3 represents the rupture zone of the last earthquake using its source parameters. It is remarkable the observation that the villages of Fostaina, Santomeri, Portes and Valmi (white squares) which suffered great damage due to the earthquake, are within the deformation zone.
[back to table of contents]
3.0 Ground Motions
3.1 Attributes of Recordings
The Achaia-Ilia earthquake was recorded by more than 21 strong motion instruments distributed around the ruptured fault segment as shown in Figure 3.1. Those instruments are owned and maintained by three agencies: (1) Institute of Engineering Seismology and Earthquake Engineering (ITSAK; http://www.itsak.gr/); (2) Geodynamic Institute of National Observatory of Athens (GEIN, www.gein.noa.gr) ; and (3) University of Patras Civil Engineering Department (UPatras; http://www.civil.upatras.gr/). Table 3.1 lists the stations owned by ITSAK and Patras that recorded the earthquake along with attributes of the stations and the recorded motions. The GEIN data was not available as of this writing and will be analyzed in later reports.
Each of the stations listed in Table 3.1 has a digital accelerometer. However, the resolution of the instruments is variable. Many instruments have QDR accelerometer having an 11.5-bit A/D converter with relatively high noise levels. Stations with those instruments can be identified in Table 3.1 by relatively large high-pass corner frequencies (0.15-0.6 Hz). Other stations have K2 or Etna accelerometers with 18.5-19-bit A/D converters. Those stations have much lower noise levels, and can be identified in Table 3.1 by relatively low high pass corner frequencies (0.05-0.07 Hz), with the exception of the Volvi stations which have a higher corner frequency due to the very large site-source distance (310 km). We also note that the Volvi stations are operated jointly by Itsak and the Aristotle University of Thessaloniki (where University of Thessaloniki). One station (zak) has a 24-bit A/D converter with very low noise levels.
Uncorrected (Volume 1) mainshock data from each of the above instruments was downloaded from the local memory and processed according to uniform criteria. Those criteria are similar to those of Boore and Bommer (2005), and consist of the following principal steps:
- The Fourier amplitude spectra (FAS) of the three components are compared with the FAS of noise (noise spectrum), which is generally obtained from pre-event signals for high resolution instruments and in time mark component for the low resolution instruments (Skarlatoudis et al., 2004).
- A preliminary high-pass corner frequency (fHP) is selected so as to maintain a minimum ratio of two of the Fourier amplitude of signal relative to noise.
- Signals are filtered at a variety of corner frequencies below, at, and above the value identified in (2). Differences in the resulting displacement waveforms are observed.
- If the shape of the displacement waveform is unaffected by corner frequency for values less than that selected in (2), fHP is taken as the minimum frequency for which no appreciable change with frequency is observed. If the shape of the displacement waveform is affected by corner frequency for values less than that selected in (2), then fHP is taken as the value from (2).
- The filtered record is baseline corrected, as needed.
The final selected fHP value taken for each instrument is shown in Table 3.1. The resulting three-component peak accelerations and velocities are also shown.
Closest distances from the instrument sites to the surface projection of the fault were taken using the approximate fault location described in Section 2.0. Those distances are shown in Table 3.1 along with epicentral distances established using the epicenter location determined by Seismological station of Aristotle University of Thessaloniki (see Section 2.0).
Figures 3.2 and 3.3 show plots of peak horizontal acceleration (PHA), peak horizontal velocity (PHV), and 5% damped pseudo spectral acceleration versus distance [Sa(1.0)]. All of the plotted ground motions are the geometric mean of the two horizontal components (as recorded). Medians (m) and medians +/- one standard deviation (s) are shown in Figure 3.2 for two Greek ground motion prediction equations (GMPEs) (Skarlatoudis et al. 2003 for PHA and PHV; Danciu and Tselentis 2007 for spectral acceleration). Figure 3.3 similarly plots these values for the Boore and Atkisonson (BA) 2008 GMPE, which was developed as part of the Next Generation Attenuation project in California. The Greek GMPE was plotted for the NEHRP C/D boundary (F=1.5) whereas the BA GMPE was plotted for Vs30=360 m/s.
Actual site conditions at the recording stations vary as shown in Table 3.1. Accordingly, to more accurately evaluate the performance of the GMPEs relative to the data, we calculate residuals for each data point considering the appropriate source distance and site condition as follows:
Ri = ln(IMi)rec - ln(IMi)GMPE |
(3.1) |
Where (IMi)rec = value of ground motion intensity measure from recording i and (IMi)GMPE = median value of that same IM from the appropriate ground motion prediction equation. The intensity measures used here are PHA, PHV, and Sa(1.0). Results of those calculations are shown in Figure 3.4 for the Greek GMPEs and Figure 3.5 for the BA GMPE.
The principal trends illustrated by Figures 3.2-3.5 are as follows:
- For the Greek GMPE, the residuals for PGA generally exhibit no significant bias over the distance range for which the model is applicable. Large negative residuals at long period indicate a change in slope in the attenuation at long distance that is not reflected in the GMPE.
- For PHV and Sa(1.0), residuals of the Greek GMPEs have a negative trend with distance, which may be suggestive of faster attenuation of data than is in the models.
- Residuals from the BA GMPE do not have noticeable trends with distance if the data from Volvi test site are excluded. The median model bias in ln units are found to be -0.73 (PHA), -0.35 (PHV), and 0.07 [Sa(1.0)] without the Volvi test site data. This suggests that the high frequency data are lower than expected from the BA GMPE whereas the mid period data are relatively consistent with the GMPE.
Figure 3.6 shows 5% damped pseudo-acceleration response spectra for a pair of stations in Patras about 15 km north east of the rupture and the pyr station south of the rupture (Figure 3.1). The Patras data have a strong spectral peak at approximately 1.0 sec, but the peak is most pronounced in the fault-normal direction. The pyr spectra are similar for both components at long period. This is suggestive of a stronger directivity pulse in the NE direction than in the SW direction, although this remains under investigation.
3.2 Observations Providing Insight into Near Fault Motions
As described in Section 3.1, there were no recordings of ground motion at distances Rjb < about 15 km. Accordingly, the nature of ground motions in many of the most affected areas are unrecorded and unknown. However, several observations provide valuable insights. We describe three here; the locations of these observations are shown in Figure 3.1.
The first observation concerns the performance of cemetery monuments located along the fault strike. Traditional Greek cemeteries feature above-ground tombs adorned with crosses, photograph frames, and similar grave markings. At cemeteries along approximately the north half of the fault, many of these objects were toppled from the tombs, as shown in Figure 3.7 (left). At a cemetery near Pinios Lake at the south end of the rupture, no such toppling was observed, as shown in Figure 3.7 (right). This suggests that the characteristics of ground motion that control the toppling of such objects were likely stronger to the north end of the fault rupture than to the south.
The second observation concerns stacked reinforced concrete railroad ties at Kato Achaia train station (N 38 deg 08.73', E 21 deg 33.71'). As shown in Figure 4.2 (site plan) and 3.8 (photographs), the large stack of ties included sections in which the preferred fall direction (short direction of ties) was oriented roughly parallel to the fault and other sections normal to the fault. The ties fell in the fault normal direction (Figure 3.8-left) but sections with the weak direction oriented fault-parallel did not fall (Figure 3.8-right). This is suggestive of fault normal polarization of ground motion, as noted also from instrumental recordings in Patras (Section 3.1). Moreover, at a beach about 700m north of the train station, an eyewitness (Elli Zisimatou, Civil Engineer, Graduate Student at University of Patras) reports shaking so violent that people were thrown off their sun loungers during the main shock (the beach was crowded on that June Sunday afternoon), and it was impossible for a person to stay standing or return to a standing position. These observations suggest that peak ground accelerations in Kato Achaia, about 5km from fault, may have been significantly stronger that those recorded in Patras.
The third observation concerns Poseidon Palace Hotel (38 deg 9.257'N, 21 deg 37.633'E). At the time of earthquake, a children pool party was going on. According to an account by Lena Kanakari, Civil Engineer, MSc, the motion at the area around the pool was extremely violent. Toppling of several heavy flowerpots and coffee-bar stools occurred, whereas according to the eyewitness accounts, it was impossible for a person to remain standing. I was also reported that during strong motion, a quantity of water was forced out of the pool in the form of a wave, in the SE direction. Interestingly no other damage was observed to the Hotel structures.
[back to table of contents]
4.0 Search for Surface Fault Rupture
Moment tensor solutions published in the immediate aftermath of the earthquake indicated shallow focal depths (on the order of 3-6 km). Accordingly, surface rupture was anticipated and a significant effort was undertaken to find and map ground cracking from surface rupture. Based on the fault strike and aftershock pattern available at that time (similar to what is shown in Figure 2.3), a region approximately 10-15 km in width in the approximate vicinity of the oval drawn in Figure 2.3 was selected for reconnaissance to search for surface rupture.
This chapter is organized into three principal sections. Figure 4.1 shows the principal study regions addressed in this chapter. First we describe ground deformations at the Kato Achaia train station (marked as Paralia Kato Achaia in Figure 4.1), which were initially reported as having been fault-related. We performed detailed mapping of this area, with the results described in Section 4.1. Section 4.2 describes our efforts to locate surface rupture in areas further south, extending to the south of Pinios Lake. We briefly summarize our findings in Section 4.3.
4.1 Kato Achaia Train Station (N 38 deg 08.73', E 21 deg 33.71')
The Kato Achaia train station was examined for possible surface fault rupture effects. A vicinity map showing the location of the train station is shown in Figure 4.1. Figure 4.2 shows a site plan of the area including the mapped surface effects.
The train station is located approximately 0.77 km from the coastline. The station has three tracks and two platforms, as shown in Figure 4.2. It sits on an alluvial floodplain 0.66 km from Piros river to the east of the site. Details on soil conditions and the groundwater depth are unknown at this time. The station operator reports that the station was constructed at around 1885, as part of Prime Minister Harilao Trikoupis' 417 km railway system encircling Northern Peloponnesus.
Our inspection of the station occurred on 10 June 2008, from approximately 12:00 to 14:00. Our reconnaissance of this site consisted of detailed mapping of the station, discussion with the station operator who was present at the time of the earthquake, and inspection of the surrounding region for signs of ground rupture.
At the time of inspection, unrepaired damage remained on the south track, as shown in Figure 4.2 and 4.3. Damage to the two north tracks had been repaired immediately after the main shock, to keep train service open, but the removed sections of rail were available onsite for inspection. The damage to the south track consists of a buckling-type failure of the rail due to compression of the ground in the direction of the rail (Figure 4.3). No strike-slip displacement of sections of rail on opposite sides of the damaged section was apparent from visual inspection (Figure 4.3). Immediately north of the buckled rail, both compression and extension features were apparent in the concrete platforms, as shown in Figure 4.2. Note that the widths of extensional ground cracks were noted in the field, but it was not possible to measure displacements across compression features. Photographs of the distress in this area are shown in Figure 4.3-4.4.
As shown in Figure 4.2, the middle rail line also suffered distress near the section of buckled south rail. At the time of our reconnaissance, this section of rail had been replaced over the lengths shown in Figure 4.2. The north rail also suffered distress requiring installation of replacement rails, but this was further to the west, as shown in Figure 4.2. Additional distress to the concrete platforms was observed in the vicinity of this replacement rail section, as shown in Figure 4.2 and 4.5. Visual inspection of the intact sections of rail on either side of (i.e., east and west of) the replaced sections indicates no apparent lateral offsets, as would be found for example from strike-slip faulting.
The damaged sections of rail were available for inspection onsite. According to the station operator, those sections were removed the day of the earthquake so that train service could continue. As shown in Figure 4.6, significant lateral displacements of the rail sections was observed in the removed segments. Those displacements are likely due to buckling failures similar to that observed on the south rail.
The station structure (made of 1m-thick stone masonry) suffered no apparent damage from the earthquake. No cracking was observed in an asphalt-paved road immediately north of the rail lines. On Apostolou Andreou Street, which is located 50 m south of the rail lines, a 19 m wide zone of ground cracking was observed, which also caused leaks in a PVC water pipeline (Figure 4.7). Ground cracks in this area were primarily extensional, with widths up to 2-3 cm.
The available data clearly indicate that ground failure occurred at the Kato Achaia train station. The cause of the ground failure is not clear, but the lack of any permanent lateral displacements across the ground failure features in the direction of fault strike does not support the presence of strike-slip surface rupture in this area. Soil failure phenomena or fault step-over deformations are other alternative mechanisms that could be investigated in future work.
4.2 Reconnaissance of Fault Zone South of Coastline
The principal reconnaissance work in search of surface fault rupture occurred on 10-11 June 2008. Additional investigations on a smaller scale were carried out over the following days.
On the basis of aftershock distribution data and damage to the meizoseismal area (including knowledge as to the railway damage in Kato Achaia Station), it was decided to search for the fault along four main paths (shown in Figure 4.1): (A) Patras - Vrachneika - Kato Achaia, (B) Kato Achaia - Fostena - Santomerio, (C) Santomerio - Porte - Valmi - Orea - Dafne, Kentron, (D) Santomerio - St. Nicholas - St. Constantin - Michoi - Kandalos - Aetorachi - Kentron. Additional paths (e.g., Peta - Mataraga) were also explored based on information obtained locally.
A difficulty in narrowing the search to a smaller zone related to the dominant morphological features of the area, mainly the orientation of the Skollis Mountain and the nearby valley in the NS direction -- which differs from the N30E strike of the aftershock distribution data (Figure 2.3).
The investigation did not produce conclusive results, as no clear fault trace was identified. Ground fissures and some ground deformation-related damage were discovered in several locations including Vrachneika, Kato Achaia, Valmi, Petas, Nisi. However, the ground failure in those areas was generally associated with either poorly compacted fill along roads, around culverts, and along drainage channels. The alignment of the ground failures and their apparent association with alternative ground failure mechanisms do not support the presence of surface fault rupture in the inspected areas. Many of those ground failures are discussed in more detail in Chapter 7.
Fissures were observed in the village of Valmi, which is close to the epicenter, as shown in Figure 4.1. Those fissures attracted the attention of Greek national TV as the fault trace. However, the fissures in this area were located on soft ground next to a slope, oriented in the East-West direction (G. Moulinos, personal communication). Accordingly, while we did not observe these areas, it appears unlikely that they are associated with surface fault rupture. Fissures were observed on the pavement of a road connecting the villages Peta and Mataraga, in the vicinity of a stream, oriented in the East-West direction (Figure 4.8). Given the presence of soft material under the pavement, the vicinity to the stream and the orientation of the cracks, these fissures cannot be linked to tectonic movement.
An interesting case of surface rupture was observed close to Nisi village about 8km southeast of the town of Varda. The associated displacements were mainly vertical, measuring up to 25cm, oriented in the NW-SE direction. On the basis of orientation and extent of these discontinuities, Kokkalas et al (2008) identified them as a co-seismic rupture. However, this area is approximately 10km from the fault as established from the mainshock and aftershock moment tensor solutions (Figure 2.3). Moreover, because liquefaction and lateral spreading were also observed in the vicinity of the cracks, it appears that these ground cracks are not likely associated with surface fault rupture. Interestingly, Nisi and Kato Achaia Station are aligned NE-SW, almost parallel to the strike of the aftershock distribution.
An important case of ground cracking was observed in Michoi village (Kokkalas et al 2008), about 1-2km from the estimated surface projection of fault, 3km from epicenter (Figure 4.1). According to Kokkalas et al, the orientation of the fissures is NNW-SSE, almost parallel to the fault. Our team did not visit the area. However, as the cracks occurred on cohesive sediments next to a slope and no lateral offset compatible to strike slip faulting is observed, they too are likely related to local ground failure.
4.3 Summary
Recall that our search for the fault rupture was motivated in part by early reports of a shallow hypocentral depth (3-6 km) and damage to rail lines at the Kato Achaia train station. Approximately one week after our reconnaissance was completed, additional information became available to better constrain the moment tensor solution (as described in Section 2.3), and the focal depth moved down to 31 km. At this depth and for the magnitude of the subject earthquake, surface faulting would not necessarily be expected. Based on the field work conducted to date, we have not seen conclusive evidence of surface rupture, and hence there is some consistency of the currently available information.
5.0 Landslides and Rockfalls
The Achaia-Ilia earthquake triggered a number of landslides and rockfalls over a wide area, as shown in Figure 5.1. Some of the most distant rock falls and slides occurred on the island of Leukas (Porto Katsiki) approximatley 100 km N-NW of the epicenter and on the national road Diakofto-Kalavrita (Pounta) 50 km N-NE of the epicenter. However, most of the landslides and rockfalls occurred in the immediate vicinity of the fault, as shown in Figure 5.1. Some of the most affected villages were Portes, Santomeri and Valmi.
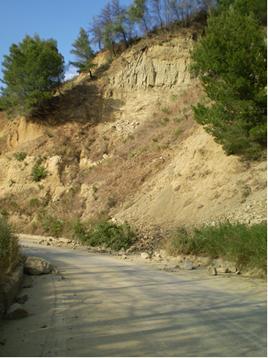
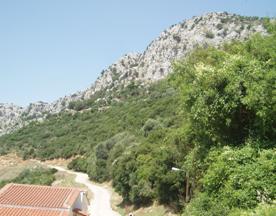
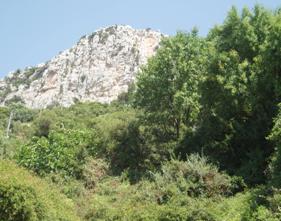
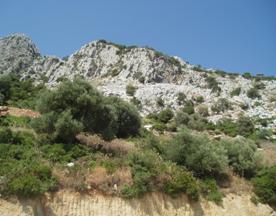
The villages of Santomeri (21.57275 deg, 37.98848 deg) and Portes (21.57413 deg, 37.93885 deg) are located at the foot hills of oblong (N-S) Skollis Mountain, which are mild natural slopes consisting of flysch with beds of sandstone and conglomerate horizons. As shown in Figure 5.2, above these foothills are steeper natural slopes (V:H = 2:1 to 5:1) consisting of limestone and dolomitic limestone strata steeply dipping towards the East. The height of those steep slopes exceeds 100m for the case of Santomeri, whereas in the case of Portes, the height of the hanging limestones is less (crude approximation: 50 to 80m).
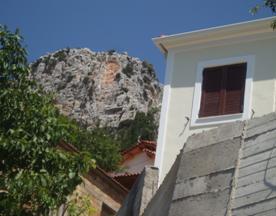
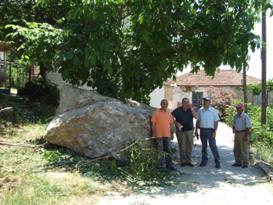
In both cases, rock toppling failures of limestones occurred during the earthquake as a result of the unfavorable combination of very steep slopes with the sub-vertical fractures and the inclined bedding. The volume of the rock blocks that toppled is crudely estimated between 1 and 7m3. In Figure 5.3, the location where a rock block was detached is shown on the left, whereas on the right is shown a detached rock block that rolled downslope and caused serious structural damage at a house in Santomeri village (fortunately with no casualties). The same features were observed in a less pronounced way at Portes village, as shown in Figure 5.4. Both villages have been declared by the Hellenic state, as "hazardous areas" due to rock detachment and toppling and therefore evacuation of the inhabitants was ordered.
Along the road from Portes to Valmi, close to Valmi, a complex type of landslide was observed on a geological unit called "formation of Valmi" (21.546613 deg, 37.90426 deg). The above geological unit consists of alternations of marly clays, silts, sands with consolidated or non-consolidated conglomerates. Significant quantities of slide debris, together with soft rock blocks partially filled the roadway. At the slopes where this landslide occurred, a mechanism of detachment of rock fragments due to the ground shaking seems to have initiated this slope instability. This mechanism of detachment (upper middle part of Figure 5.5 at left) possibly developed due to pre-existing sub-vertical fractures or planes of weakness of the rockmass sub-parallel to the slope face. Once the rock blocks were detached, then they rolled down the mild slope, and they gradually became scree deposits due to their poor mechanical properties. However, some relatively hard boulders fell in the road or crossed it. The steep part of the slope is estimated to be up to 40m tall with an approximated inclination of V:H=3:2 to 2:1. The length of the scree deposits exceeds 100m, whereas the width is ranging approximately from 20 to 40m.
At the same area, toppling of the upper layers consisting of harder marly sandstones was observed, as shown in Figure 5.6.
The town of Kato Ahaia is located near the northern terminus of the rupture. A number of landslides occurred in road cuts, typically in marl layers dipping towards the road (locations are 21.642442 deg 38.146956 deg; 21.614043 deg, 38.135692 deg; 21.595589 deg, 38.137729 deg). Westward and an eastward views of one such the slide and strata orientation are shown in Figure 5.7. The slope was steep (V:H = 2:1). The slide was of limited volume and the debris covered a part of the road since the landslide seemed to be superficial. Additional locations of landsliding in this northern area are marked on Figure 5.1.
[back to table of contents]
6.0 Performance of Pinios Dam and Earth Retaining Structures
6.1 Pinios Dam
Pinios dam (37 deg 54.01'N, 21 deg 26.91'E) is a zoned earth dam (with a clay core and gravelly shells) in the vicinity of the village Kentro. As shown in Figure 6.1, the reservoir impounded by the dam is located at the southern terminus of the fault rupture identified in Section 2.0. Its construction started in the second half of the 1960's and was completed in 1972. It has a height of 50m, a crest width of 10m and a length of 2km. Figure 6.2 is a plan view of the dam from GoogleEarthTM. The inclination of the downstream and upstream slopes of the dam is about 2.5 horizontal to 1 vertical, and are visible in Figure 6.3. The filling of reservoir was completed in about 1977 and its water is used for irrigation.
At the time of its construction the dam was equipped with a large number of pore water pressure transducers, survey monuments and settlement markers. The displacements of the slopes of the reservoir were also being monitored until December 31, 1979. Most of this equipment stopped functioning (due to damage) during the decade of the 1980's. At present all instrumentation is out of order.
At the time of the earthquake the water depth behind the dam was about 25m. No earthquake damages were observed in the dam (crest, slopes, spillway, outlet tower, abutments). Figures 6.3-6.5 show the main embankment, outlet tower, and spillway, all of which were found to have no visible damage from the earthquake. However, the occurrence of soil liquefaction with sand ejecta has been reported in several locations in the area surrounding the reservoir (http://users.auth.gr/~ac/Files/AUTh_quick_report.pdf).
6.2 Earth Retaining Structures
Earth retaining structures generally performed well during the mainshock. Retaining structures for ports (e.g., quay walls) are not addressed here (see Chapter 8). In inland areas, retaining structures are typically gravity-type concrete walls, of the type shown in Figure 6.6. Note the lack of damage to these walls, in the village of Flokas. Structural damage to wall was observed in Agiovlasitika village, as shown in Figure 6.7.
[back to table of contents]
7.0 Liquefaction and Ground Failure
The effects of liquefaction and other forms of ground failure were observed over a broad region in the near fault region and in several coastal areas. Some incidents of ground failure are described elsewhere in this report. For example, ground failure encountered in the search for surface rupture is discussed in Section 4.0. Ground failure in coastal ports and harbors is discussed in Section 8.0. Ground failure encountered in other areas is discussed here. The section is organized into relatively detailed discussion of two areas for which detailed mapping was performed and a general discussion of other areas. The two areas with detailed mapping are (1) a lateral spread near the Kato Achaia train station and non-liquefaction in nearby areas and (2) coastal subsidence in Vrachneika. The other areas addressed are Manolada, Pinios Lake margins, and Nisi. Those locations are shown in Figure 7.1.
7.1 Liquefaction and Non-Liquefaction Near Kato Achaia
In Kato Achaia, liquefaction was observed in two areas, both of them located near the sea, at a distance about 770 m north of Kato Achaia train station (discussed in Section 4.1). The first area, referred to here as "eastern site" (GPS coordinates, 38.15179 deg, 21.56338 deg) is approximately a 150m x 90m lot ending about 30m from water, as shown in Figure 7.2. Contrary to the surrounding areas which are covered by vegetation, the specific lot was practically empty. The site was first visited on 11 June 2008 and was subsequently surveyed using GPS total station equipment on 14 June 2008. According to the owner, who was present during the second visit, the site was rich in gravelly material, which was excavated approximately 10 years ago by a construction company up to a depth of 5-6 m and was replaced by filling material, which seems to have included sandy silt and silty sand. Accordingly, the site contained different material than the surrounding locations, which did not liquefy.
As shown in Figures 7.3-7.6, four basic liquefaction effects were observed to be manifest at the ground surface: (1) sand boils, (2) empty cracks, (3) cracks filled with liquefied soil, (4) flows of liquefied material. In most spots, the liquefied material was gray, which seemed to be a silty sand or sandy silt based on approximate field classification. In other spots, brownish material with higher sand content was observed (e.g., Figure 7.5). Samples were collected for classification testing (sieve analysis and Atterberg limits). However, the material sampled at the surface may not accurately represent the material in the liquefied layer at depth. Crack widths varied between approximately 2 to 8 centimeters, as shown in Figure 7.2. Examples of flows are provided in Figures 7.5 to 7.6. Summation across crack widths indicates a total lateral spreading towards the sea of the order of at least 20 cm. The lateral spread was towards the sea, near which a break in slope occurs as shown in Figure 7.2. Subsurface bathymetry is not available at this time, but based on the morphology visible at the surface, the spread geometry would appear to be of the free-face type.
The second area is located approximately 200m west of the eastern site, and is referred to as "western site." In an area between GPS coordinates xx and yy, ground failure was generally not observed in reconnaissance performed on 11 June 2008 except for a relatively minor occurrence of liquefaction at GPS coordinates 38.15319 deg, 21.55889 deg (sand boils, no lateral spreading). The sand boils at that location are shown in Figure 7.7.
7.2 Coastal Subsidence in Vrachneika
Ground cracking consistent with lateral extension and minor downdropping was observed in Vrachneika. See Figure 7.1 for a location map of this ground distress.? The cracking was typically manifest in a coastal two lane road paved with asphalt and in building structures south (landward) of the road. The road is called Strayropoulou Street over a portion of its length (east side).
Ground cracking was typically oriented sub-parallel to the coast and manifest approximately 15 m from the coastline in the street. Typical crack widths were approximately 3-6 cm. No soil ejecta was observed at the ground surface in the vicinity of these cracks. It is unknown at present if the affected soil is fill or natural ground.
The reconnaissance team was granted access to a two-story reinforced concrete structure at 74 Strayropoulou Street. According to the owner, the foundation consists of concrete perimeter footings with a slab-on-grade floor slab. Original construction occurred in 1975.
This structure is located on the south (landward) side of the street, approximately 20 m from the coast. Mapping was performed of the ground deformations relative to the structure and associated structural distress. The mapping of distress at this structure is shown in Figure 7.10. Figure 7.11 shows photographs of distress at locations shown in Figure 7.10. The major features shown in Figure 7.10 are an extensional ground crack of approximately 3-6 cm in width that passes along the back of the pair of structures (only the interior of the east structure was inspected). Interestingly, the ground crack moves southward when it encounters the building foundations. Although the structures were damaged, crack widths within the floor slabs and walls are much narrower than the ground cracks, as shown in Figure 7.10. The 4 cm vertical uplift of the foundation relative to surrounding ground at the rear of the structure suggestive of possible rotation and differential settlement of the building structure towards the sea. This could be confirmed by floor level surveys, but such data is not available at present.
7.3 Other Areas
Minor liquefaction was observed in Manolada beach approximately 18 km NE of Andravida, about 20 km from the fault (GPS coordinates 38.061 deg, 21.3276 deg). Liquefaction was manifest in the form of small sand boils involving clean sand (Figure 7.10). The distance of the sand boils from the water was approximately 50 to 70m. No cracks and/or flows were observed.
Chatzipetros et al (2008) report that liquefaction and lateral spreading in the form of surface cracks was observed along the banks of Pinios reservoir, at the southern end of the fault. As we did not visit the area we cannot provide additional information on those features.
An interesting case of liquefaction was reported at Nisi village (Kokkalas et al, 2008), located about 10km from fault, close to the town of Varda. This location is, remarkably, away from water. The pictures provided by Kokkalas et al. indicate sand boils and cracks filled with liquefied material (possibly involving silt). The same authors report extended surface fissures, which they associate with a surface manifestation of the seismic fault (additional details in Section 4). We did not visit the site.
[back to table of contents]
8.0 Performance of Ports
Three major ports (Patras, Kyllini and Katakolo) are located in the region affected by the earthquake, as shown in Figure 8.1. In addition, a number of fishing-boat harbors and marinas are located in the same general area. The most important among them are the ones in Kato Achaia and Amaliada, which are also shown in Figure 8.1.
8.1 Port of Patras
The performance of the Port of Patras was in general very satisfactory, as port operations continued uninterrupted following the earthquake. The strong motion station labeled pat_3sym (see Figure 3.1 and Table 3.1) is located in Trion Symahon square approximately 500 m from the breakwater, as shown in Figure 8.7. Ground motion values recorded at that station are given in Table 3.1. The station was installed and is operated by the Laboratory of Geotechnical Engineering of the Civil Engineering Dept. of the University of Patras.
The breakwater (North end: 38 deg 15.260'N, 21 deg 43.926'E, South end: 38 deg 14.878'N, 21 deg 43.592'E) has a length of approximately 900m. Figure 8.2 is a view along the breakwater and Figure 8.3 shows its cross section (above sea level). It is a stone masonry structure consisting of consecutive, 6m long segments, with a 0.20m separation distance between them, which is shown in Figure 8.4. No earthquake damage or distress was observed in the breakwater, with the exception of:
- signs of minor longitudinal compression in the concrete slab bridging the open space between consecutive segments, as shown in Figure 8.5, and
- detachment of a few stones from the landward face of one segment of the breakwater, as shown in Figure 8.6.
It is not certain that the above observations are related to earthquake effects.
St. Nicolas mole (38 deg 15.022'N, 21 deg 43.989'E) was constructed by enlarging a pre-existing smaller mole. It has a length of 220m and a width of approximately 80m. The mole has been constructed at a water depth of about 8m.
Surface subsidence of about 0.10m occurred as a result of the earthquake near the edge of the mole, as shown in Figure 8.7. Longitudinal cracks were also developed along the two sides of the mole, with a maximum width of about 5mm. Similar cracking was also developed on the pavement of the quay wall close to the entrance of the mole. It is known however, that the above features have repeatedly appeared in the past (due to consolidation of soft sediments beneath the mole) and are being constantly repaired.
8.2 New Port of Patras (38 deg 13.683'N, 21 deg 43.270'E)
The New Port of Patras (currently under construction) is located at about 3km S-SW of the Patras Port, Figure 8.1. At the present time the 1st part of the project (about 900m of breakwater and 500m of quay wall) has been completed and is a property of the Ministry for the Environment, Physical Planning and Public Works of Greece (YPEXODE), Figure 8.12. The 2nd part of the project is under construction, and includes the extension of both the breakwater and quay wall by approximately 400m. The subject of the reconnaissance was the completed 1st part of the project.
The breakwater (of vertically composite caisson type), Figure 8.13 (North end: 38 deg 14.024'N, 21 deg 43.028'E, South end: 38 deg 13.580'N, 21 deg 42.843'E) has been constructed using concrete caissons (with a length of 21m, height of 12m and width of 11m) laying on a trapezoidal rock fill with berms. The rock fill is founded at a water depth of about 30m on a seabed improved by large diameter stone columns.
The performance of the breakwater was quite satisfactory with only minor signs of distress (joint compression, joint opening and differential settlement, less than 30mm) at 3 or 4 joints, as shown in Figures 8.14 to 8.16. A geodetic survey performed following the June 8, 2008 earthquake, has indicated a settlement of the entire breakwater of about 0.35m, with reference to the latest available measurement taken at the end of 2005. At the time of writing, it is not known which portion of this settlement was caused by the main shock (an initial assessment is 0.20m).
The quay wall (caisson structure) has been constructed using the same type of caissons (as for the breakwater), Figure 8.17. The caissons are founded on a rubble (at -11m), over a soil improved by preloading (using vertical drains) and installation of stone columns. No signs of distress were observed in this type of port structure as a result of the June 8, 2008 earthquake shaking.
8.3 Port of Kyllini (37 deg 56.214'N, 21 deg 8.948'E)
There is no evidence of earthquake-related distress at the structures of Port of Kyllini, which is shown in Figure 8.18.
8.4 Port of Katakolo (37 deg 38.700'N, 21 deg 19.224'E)
No data or observations are available for the Port of Katakolo.
8.5 Kato Achaia (Alykes) Fishing Harbor (38 deg 09.441'N, 21 deg 32.399'E)
In the coastal village Alykes (close to Kato Achaia), the facilities of the fishing harbor include small quay walls, piers and jetties, which are mostly used by fishing boats - trawls. The harbor is protected by two main jetties constructed of earth materials, as shown in Figure 8.19.
As a result of the earthquake, two main types of damage were observed:
- Subsidence, rotation and seaward inclination of small concrete quay walls, as shown in Figures 8.20 and 8.21. The above movements resulted in crack opening (sub-parallel to the coast) near the landward end of the concrete blocks. In one case a separation crack appeared between the foundation of a house and the surrounding ground, about 15m from the quay wall, as shown in Figure 8.22.
- Development of longitudinal cracks (width ranging from 1cm-4cm) in the jetties, in a direction mainly sub-parallel the axis of jetty, as shown in Figure 8.23. In the case shown in Figure 8.24, development of surface cracking and related soil movement, caused the breakage and horizontal displacement of the upper part of a small earth retaining brick wall.
8.6 Amaliada harbor (37 deg 45.219'N, 21 deg 18.261'E)
No data or observations are available for Amaliada harbor.
9.0 Seismic Response of Structures
9.1 Typical structural systems in Prefectures of Achaia and Ilia
In the large area affected by the 8 June 2008 earthquake (Prefectures of Achaia and Ilia in NW Peloponnese) one can find almost every kind of structural system that is typically used in Greece. The majority of structures in the area can be classified in the following five broad categories according to their structural type:
- One or two-storey masonry buildings with load-bearing stone or brick or mudbrick walls
- Reinforced concrete buildings
- Monuments and other buildings of cultural heritage
- Steel structures
- Bridges
9.2 Strong Ground Motion Compared to Seismic Code Provisions
The first Greek Seismic Code (AK) was issued in 1959, and was revised in 1984. A major new revision took place in 1992 (EAK1992), and upgraded versions were published in 2000 and 2003 (EAK2003). Until 1992, design was based on maximum allowable stresses, and thereafter on ultimate strength. For the Prefectures of Achaia and Ilia, the base shear seismic design coefficient, according to the 1959 Greek Seismic Code was epsilon = 0.06, 0.08 and 0.12, for firm, medium and soft soils, respectively. This coefficient was constant, independent of the building's period and applied uniformly to all buildings. Since the 1959 Code was based on the allowable-stress design method, the coefficient is modified to correspond to ultimate strength design, leading to values of epsilon' =0.10, 0.14 and 0.20 (Anagnostopoulos et al., 1986). Seismic codes from 1992 and onwards, establish a ground acceleration coefficient of alpha = 0.24 and typical design spectra (with a spectral magnification factor beta0 = 2.5). In Figure 9.1, the response spectra (for 5% damping) of the horizontal components of the 8 June 2008 mainshock -- as recorded at various stations of the National Accelerometer Network maintained by ITSAK - are compared with the elastic design spectra of the Greek Seismic Code (EAK2003) provisions (for various soil types). In the same figure, the pre-1992 provisions (AK) are also plotted.
From Figure 9.1 it is obvious that the post-1992 seismic codes for R/C buildings prescribe in general design forces bigger than the seismic demand at locations where the mainshock was recorded (note that all recording stations belong to EAK2003 soil type B, with the exception of VAR2 station that corresponds to soil category C; note that the EAK site categories have no direct correspondence to the NEHRP site categories shown in Table 3.1). The sharp peak at 0.2 sec of the PYR1 T-component has an effective pseudoacceleration comparable to the design spectrum, while the small surpassing of the design spectrum by the PAT3 T-component in the 1.0 to 1.3 sec range can only affect very flexible buildings, which are very scarce (if any) in the city of Patras. The ratio of the response spectrum of an earthquake event to the design spectrum provisions gives an indication of the ductility demands imposed by this particular event to structures with the corresponding fundamental period. Thus, from Figure 9.1, and for pre-1992 R/C buildings built according to the old AK1959 code, ductility demands derived from the response spectrum/design spectrum ratios are found in general to be greater than the available ductility in those structures. Hence, damage in such buildings would be expected. Nonetheless the observed behaviour of R/C buildings generally, including pre-1992 buildings, was quite good. In most cases, cracking of infill walls likely absorbed a significant part of the seismic energy, thus effectively protecting the structural R/C system. It is noted that existing buildings posses a substantial amount of strength reserves (depending mainly on their redundancy and on the overstrength of individual structural members), as well as possible additional energy dissipation mechanisms.
9.3 Structural damage in the meisoseismal area
The earthquake of 8 June 2008 caused considerable damage to structures in the Prefectures of Achaia and Ilia. Following the earthquake, a team of Earthquake Engineers of ITSAK visited the following urban centers in the area: Didachaiika, Fostaina, Santomeri, Portes, Valmi, Kentron (Pinios dam), Amaliada, Pyrgos, Gastouni, Vartholomio, Andravida (and nearby villages of Staphidokampos and Strousi), Kato Achaia, Vrachnaiika, Patras (Figure 9.2).
A brief overview of the observed damage to each structural type follows. At the end of the chapter photos of characteristic damage cases to buildings are included.
1. Masonry buildings
Masonry residential buildings have usually one to two storeys; they constitute a considerable percentage of the building stock in the stricken area, and are typically found in the villages. A special subcategory are residential brick masonry buildings of cultural importance, which are described in more detail in paragraph c (Monuments and other buildings of cultural heritage). Damage (cracking and collapse of stone/brick/mudbrick walls) in the rest, common buildings can be attributed mainly to insufficient or nonexistent seismic resistance measures (almost all of them were not built according to any seismic code), as well as to their already poor condition (old age, inadequate maintenance) even before the earthquake. Partial or total collapse of such buildings was observed mainly in the villages of Fostaina (Figure 9.5), Santomeri, Valmi, Kato Achaia (Figure 9.18, 9.19) and Vrachnaiika. Especially in the village Valmi, more than 80% of the buildings were severely damaged (Figure 9.8, 9.9). In contrast, recently renovated / strengthened masonry buildings in the village of Santomeri did not suffer major damage. In the same village a corner of a masonry building was destroyed by a huge boulder that detached (along with others that fell on the road) from the steep hill side overhanging the village (see Figure 9.7 and Chapter 5).
2. Reinforced concrete buildings
In most cases damage was concentrated in non-load bearing components, mainly brick infill walls. Diagonal cracks (Figure 9.11, 9.16) or detachment of the walls from the surrounding R/C frame (Figure 9.13, 9.15) was the most usual failure. In some cases damage to R/C elements was observed. In the village of Didachaiika a two-storey R/C building collapsed (built in 1984, with a soft ground storey) (Figure 9.4). In the village of Valmi, a two-storey R/C building suffered severe cracking at the top of the load-bearing elements (columns and shear walls) of the ground floor. At the port of the city of Patras, limited cracks were observed at shear walls of the Customs building (which also houses other public authorities). In the same building (which was put out of service), extensive damage to infill walls was observed (Figure 9.21). The Agios Andreas hospital also at Patras was evacuated, until further assessment of its actual structural condition is performed. In the town of Lehaina, several short R/C columns at the ground floor of the two-storey Fire department building were severely cracked.
3. Monuments and other buildings of cultural heritage
The most extensive failures to this class of buildings were observed in masonry churches (Figure 9.17) and their bell towers (Figure 9.20). The majority of churches in the area have stone masonry exterior walls with an orthogonal plan. Cracking was observed at the exterior walls (mainly near window and door openings), as well at the junctions of the exterior walls. Damage to masonry bell towers was also observed at the height above which the tower protrudes from the adjacent main building or at the columns at bell level where large openings are found. In several cases of masonry buildings of cultural heritage, damage was mainly concentrated around openings or at the top of the exterior walls on which wood (in most cases) roofs rest. In the town of Amaliada, severe cracks at several interior masonry arches were observed at the church of Agios Athanasios (Figure 9.12). The exterior walls of the church were strengthened (at their exterior face) in 1995-1996 with gunite and did not present any damage. In the same category fall brick masonry residential buildings of cultural importance. Most of them were either renovated or generally in a better maintenance state than the rest, common masonry buildings of the area, and hence presented an overall better seismic behaviour. In these buildings the observed damage consisted mainly of cracking at the upper parts of load bearing walls or at window and door openings.
4. Steel structures - Bridges
No significant structural damage was reported to steel structures or bridges in the stricken area.
5. Additional remarks
- According to resident descriptions, significant displacement and overturning of furniture and housing equipment took place during the earthquake, as well as fall of wares from shelves of commercial shops. In cemeteries, overturning of crosses and other decorative marble elements as well as displacement of horizontal marble plates was observed (see Chapter 6 for further discussion of cemeteries).
- The building inspections performed by the public authorities shortly after the earthquake aimed mainly at establishing if it was safe for the residents to keep living in their accommodations, so they made use of a habitable / non-habitable classification of each residency. Although this is an effective procedure for a mass inspection of a large number of buildings in a short time, it does not give adequate information for a reliable assessment of the actual structural condition of the buildings in the stricken area. For such a scope, more detailed further investigations are needed.
9.4 Conclusions
- In many common masonry buildings extensive cracking and collapse of the load-bearing walls was observed. Most such buildings of the area have no special seismic resistance measures (even of an empirical nature) that can be found in other, more seismic-prone areas of Greece (almost all of them were not built according to any seismic code). Also many were already in poor condition (due old age, inadequate maintenance) even before the main event.
- In several renovated brick masonry buildings of cultural importance, cracking at the upper parts of load bearing walls or at window and door openings was observed. This can be attributed to the insufficient anchoring of the new restored wooden roofs to the walls and the lack of confining wood belts along the top perimeter of the external walls, in combination with the lack of sufficient axial (gravitational) loads at masonry columns at the upper levels of the walls.
- In many church bell towers in contact with the main building, damage was observed at the level above which the tower protrudes from the adjacent main building or at the columns at bell level where large openings are found.
- In most cases of R/C buildings, damage was confined to the cracking of infill brick walls, which thus absorbed a significant part of the seismic energy. In a few cases, damage to R/C elements was observed to buildings built according to the old 1959 Greek seismic code and can usually be attributed to various, already known from previous seismic events factors (soft storey, short columns, inadequate beam-column reinforcement etc). The R/C building that collapsed at the village of Didachaika also falls within this category.
9.5 Instrumentation of a R/C building
Shortly after the main event, the Earthquake Engineering division of ITSAK instrumented the five-storey R/C building that houses the Technical Chamber in the city of Patras with a 12-channel structural accelerometer array in order to record its response during the aftershock sequence. Some details related to this instrumentation are illustrated in Figure 9.3.
Tables
Table 2.1. Information on source parameters of historical earthquakes in NW Peloponnese (Papazachos and Papazachou, 2003).
Date |
Latitude |
Longitude |
M |
I Max |
Locality |
1785.02.10 |
38.2 |
21.7 |
6.4 |
IX |
Patras |
1804.06.08 |
38.1 |
21.7 |
6.4 |
IX |
Patras |
1806.01.23 |
38.3 |
21.8 |
6.2 |
VIII |
Patras |
Table 2.2. Information on source parameters of moderate magnitude earthquakes which occurred in NW Peloponnese
Date |
Origin Time |
Latitude |
Longitude |
Depth |
M |
1988.10.16 |
12:34:04.00 |
37.910 |
21.060 |
9 |
6.0 |
1989.06.07 |
19:45:53.33 |
38.000 |
21.630 |
5 |
5.2 |
1993.03.26 |
11:58:18.47 |
37.660 |
21.300 |
14 |
5.4 |
1993.07.14 |
12:31:49.18 |
38.170 |
21.770 |
2 |
5.6 |
2002.12.02 |
04:58:48.45 |
37.568 |
21.076 |
0 |
5.5 |
2007.10.27 |
05:29:39.60 |
37.706 |
21.345 |
0 |
5.5 |
Table 2.3. Information on the fault plane solutions and the moment magnitude, Mw, estimations by various institutions.
|
NP1 |
NP2 |
Mw |
|
Strike |
Dip |
Rake |
Strike |
Dip |
Rake |
HRV |
210 |
86 |
162 |
301 |
72 |
4 |
6.3 |
INGV |
210 |
85 |
179 |
300 |
89 |
5 |
6.4 |
ATH |
210 |
82 |
175 |
301 |
86 |
8 |
6.4 |
THE |
211 |
90 |
178 |
301 |
88 |
0 |
6.5 |
USGS |
30 |
89 |
-160 |
299 |
71 |
0 |
6.3 |
Table 2.4. Information on the source parameters of the aftershocks with M4.0 (http://lemons.geo.auth.gr)
DATE |
ORIGIN TIME |
LATITUDE |
LONGITUDE |
DEPTH |
M |
20080608 |
124053.9 |
38.0535 |
21.5753 |
13.1 |
4.6 |
20080608 |
124339.8 |
38.1015 |
21.5842 |
19.3 |
5.0 |
20080608 |
124652.9 |
38.1132 |
21.6235 |
18.1 |
4.7 |
20080608 |
125513.9 |
38.0947 |
21.6292 |
11.8 |
4.7 |
20080608 |
131127.3 |
38.0078 |
21.5640 |
8.2 |
4.0 |
20080608 |
131853.8 |
38.0290 |
21.5170 |
8.8 |
4.3 |
20080608 |
132030.1 |
38.0342 |
21.5655 |
10.0 |
4.1 |
20080608 |
132749.8 |
38.1182 |
21.6053 |
18.5 |
4.4 |
20080608 |
133134.7 |
38.0143 |
21.5535 |
11.3 |
4.2 |
20080608 |
134148.7 |
37.9465 |
21.5225 |
4.4 |
4.3 |
20080608 |
134742.5 |
37.9903 |
21.5285 |
8.8 |
4.0 |
20080608 |
140107.7 |
38.0670 |
21.5745 |
11.2 |
4.4 |
20080608 |
142229.5 |
38.0427 |
21.5878 |
0.0 |
4.0 |
20080608 |
161006.6 |
37.9577 |
21.5413 |
3.2 |
4.6 |
20080608 |
213942.9 |
38.0337 |
21.5968 |
3.7 |
4.0 |
20080608 |
214830.4 |
37.9727 |
21.5382 |
3.2 |
4.3 |
20080609 |
013203.8 |
38.0420 |
21.5788 |
4.7 |
4.6 |
20080609 |
135321.7 |
38.0277 |
21.5402 |
8.9 |
4.5 |
20080609 |
161840.9 |
38.0425 |
21.5753 |
6.8 |
4.3 |
20080611 |
023722.6 |
37.8603 |
21.7390 |
12.3 |
4.6 |
20080611 |
024400.8 |
38.0415 |
21.5693 |
4.4 |
4.2 |
20080612 |
031534.7 |
37.9737 |
21.6500 |
12.6 |
4.4 |
20080612 |
124906.3 |
38.0438 |
21.5357 |
2.6 |
4.3 |
20080613 |
064808.1 |
37.9345 |
21.5300 |
6.4 |
4.0 |
20080617 |
091843.5 |
36.4168 |
21.7073 |
12.8 |
4.0 |
20080618 |
175726.3 |
38.0762 |
21.5972 |
0.0 |
4.2 |
Table 3.1. Strong motion stations that recorded the mainshock, including station and recording attributes
[back to table of contents]
Figures
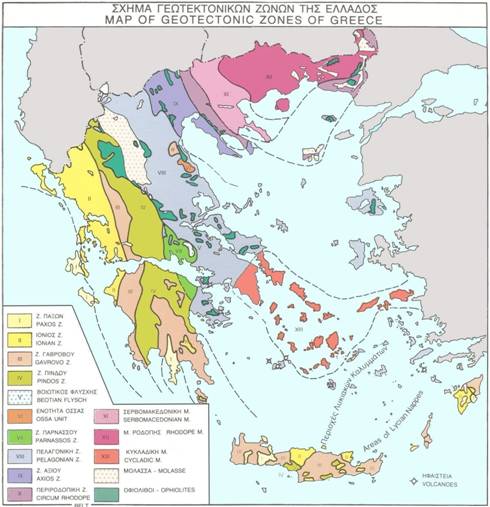
Figure 1.1. Basic Geotectonic zones of Greece (IGME Athens Greece, 1989)
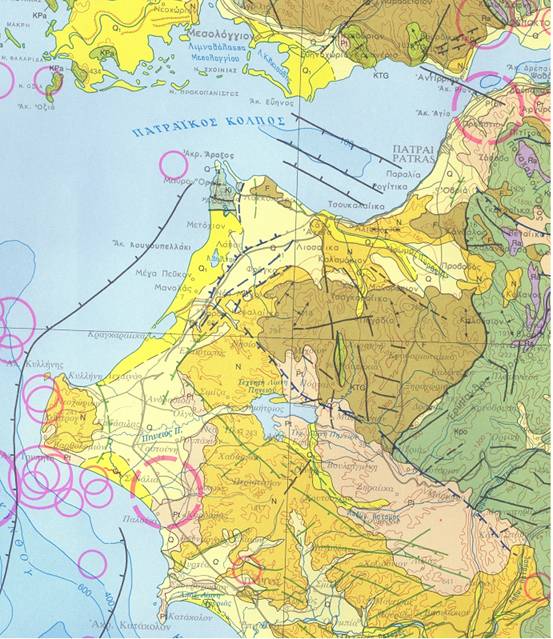
Figure 1.2. Seismotectonic map of region in Greece affected by earthquake
(IGME Athens Greece, 1989)
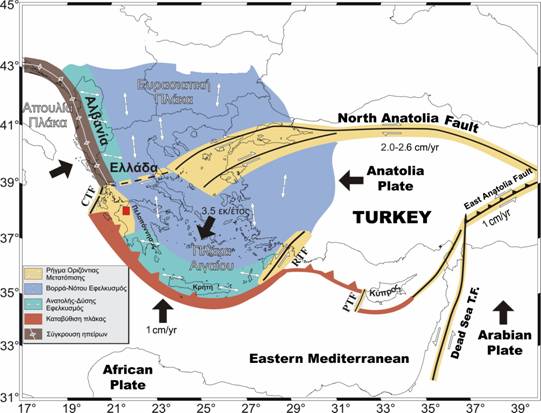
Figure 2.1. Plate motions that affect active tectonics in the Aegean and surrounding regions (Papazachos and Papazachou, 2003). The red square depicts the epicenter of the earthquake of June 8, 2008.
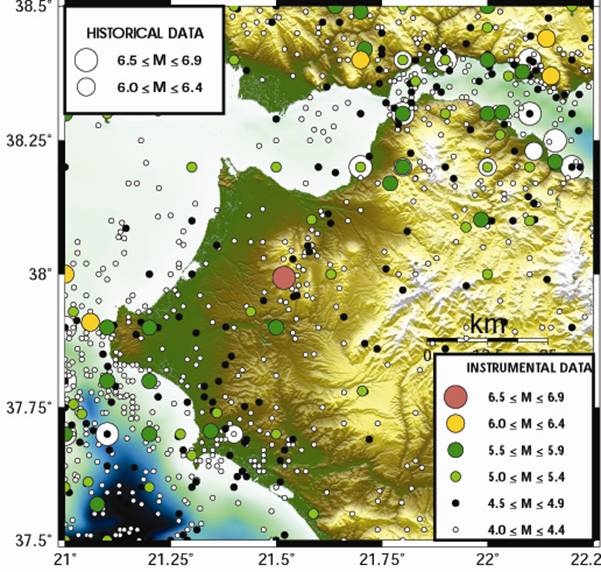
Figure 2.2. Geographical distribution of shallow earthquakes in the broader area of north-western Peloponnese.
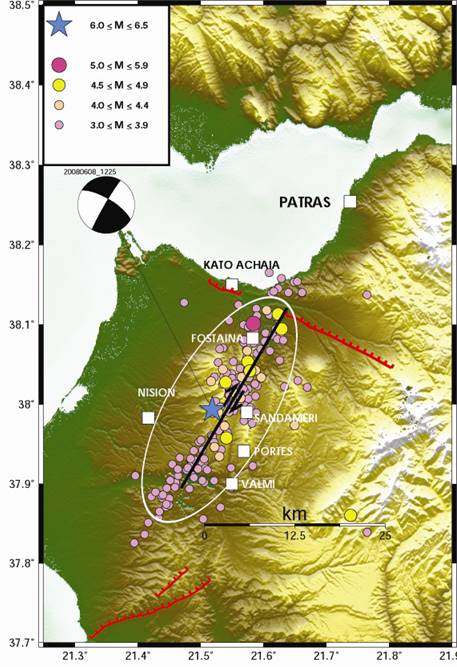
Figure 2.3. Aftershock distribution, fault plane solution determined by HRV, fault of the June 8, 2008 sequence (black) and already mapped faults (red) The star denotes the epicenter of the main shock.
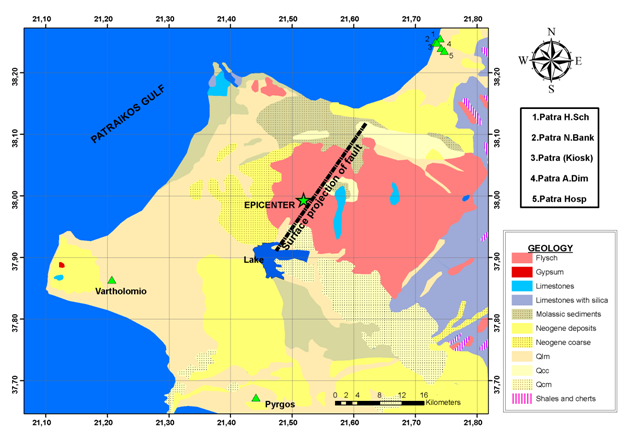
Figure 3.1. Strong motion stations located near the ruptured fault segment.
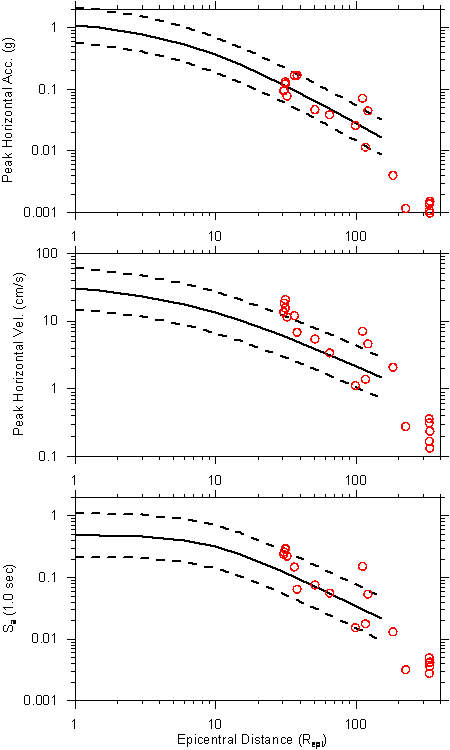
Figure 3.2. Comparison of intensity measures from recorded ground motions to predictions of Greek ground motion prediction equations for C/D boundary (Skarlatoudis et al. 2003 for PHA and PHV; Danciu and Tselentis 2007 for spectral acceleration)
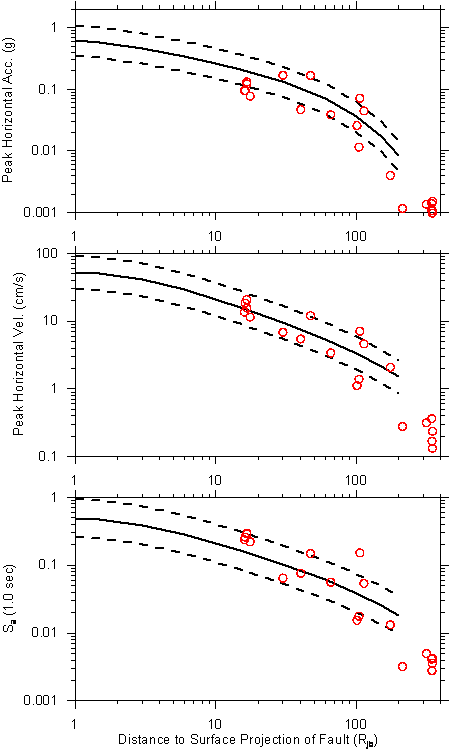
Figure 3.3. Comparison of intensity measures from recorded ground motions to predictions of Boore and Atkinson ground motion prediction equation for Vs30=360 m/s
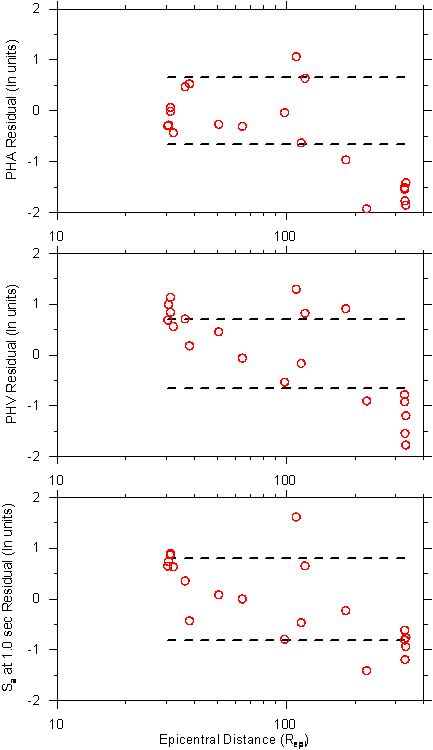
Figure 3.4. Residuals of intensity measures from recorded ground motions relative to predictions of Greek ground motion prediction equations (Skarlatoudis et al. 2003 for PHA and PHV; Danciu and Tselentis 2007 for spectral acceleration). Dashed lines indicate +/- one standard deviation from the GMPEs.
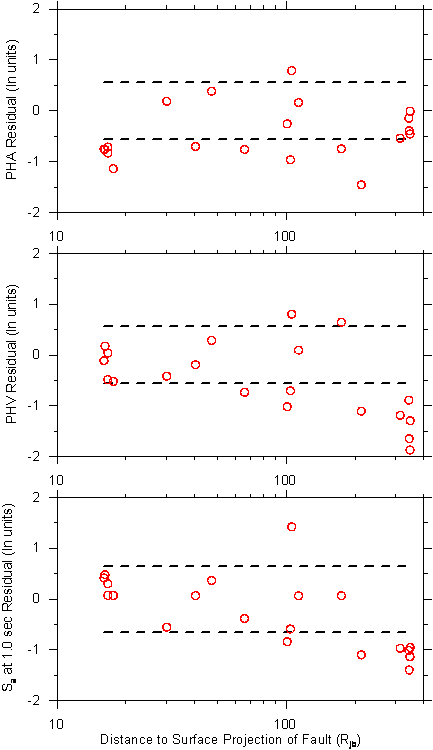
Figure 3.5. Residuals of intensity measures from recorded ground motions relative to predictions of Boore and Atkinson ground motion prediction equation. Dashed lines indicate +/- one standard deviation from the GMPE.
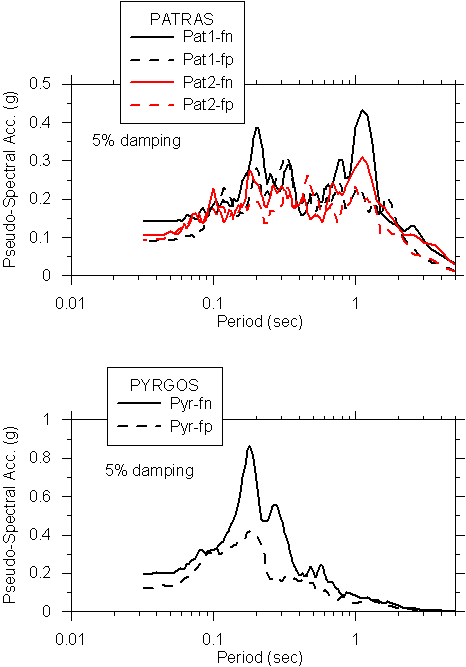
Figure 3.6. Pseudo-acceleration response spectra at 5% damping at two stations north of the fault in Patras (top frame) and one station south of the fault (bottom frame). Note the polarization of shaking in the fault normal direction at periods longer than approximately 0.8 sec in the Patras recording and the lack of such polarization in the Pyr recording.?
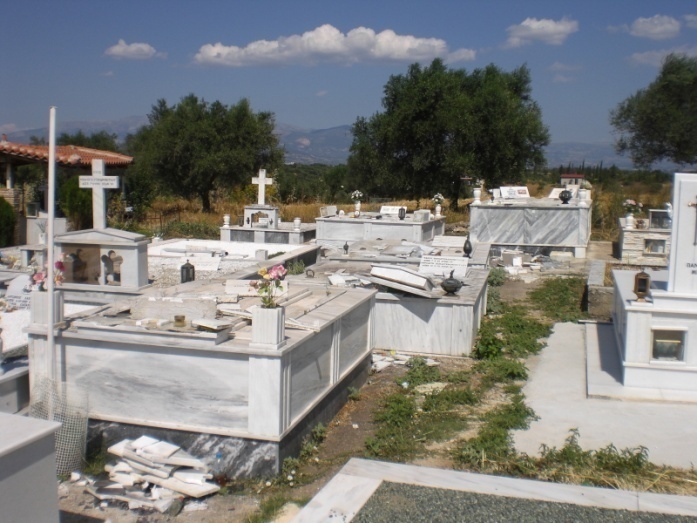 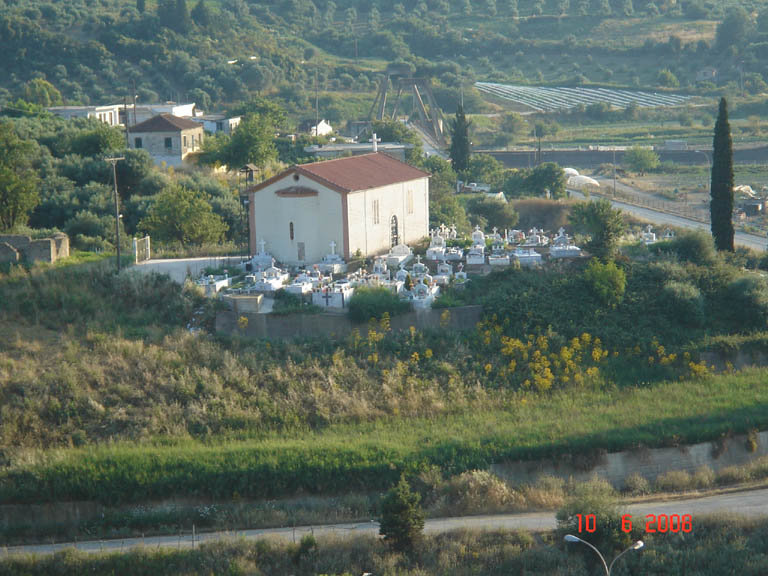
Figure 3.7. View of toppled cemetery relics at Ano Achaia (left) and lack of toppling at Kentro (right).
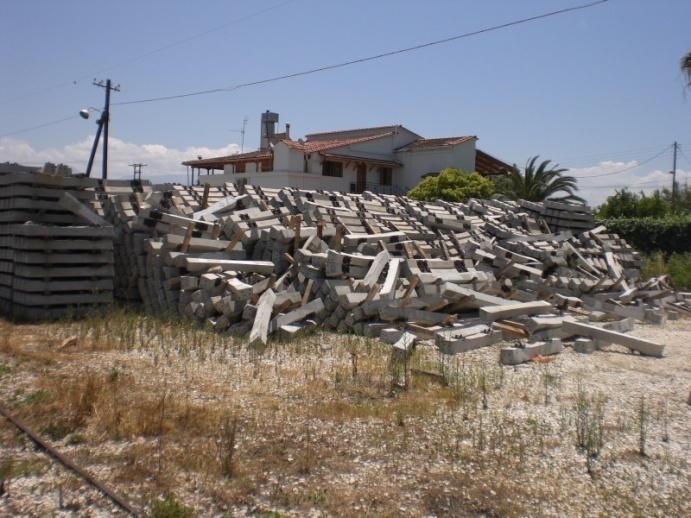 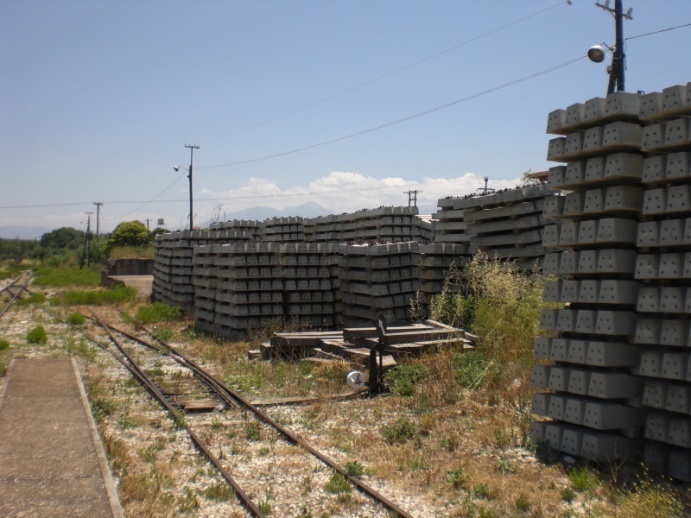
Figure 3.8. View of fallen railroad ties in fault normal direction (left) and lack of fall of ties at same location in fault parallel direction (right).
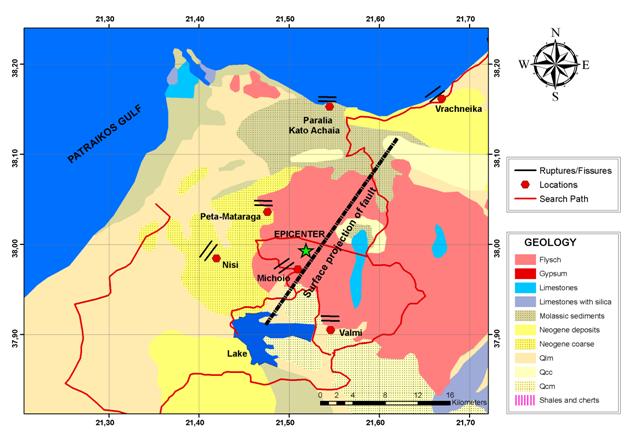
Figure 4.1. Map showing locations of identified ground cracking in search for surface rupture and paths followed by reconnaissance team
Figure 4.2. Site plan of Axata train station showing major surface improvements and observed distress. Note exaggeration of scale in reference NS direction.
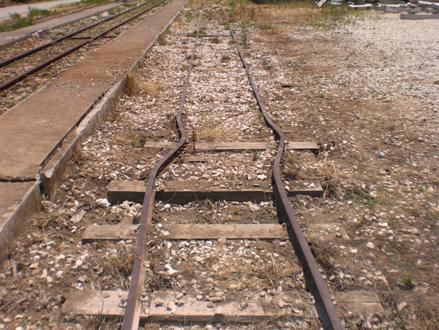
Figure 4.3. Photograph of buckled section of rail on south rail line. Note also distress in platform on left side of picture. Marked as Photo a in Figure 4.2.
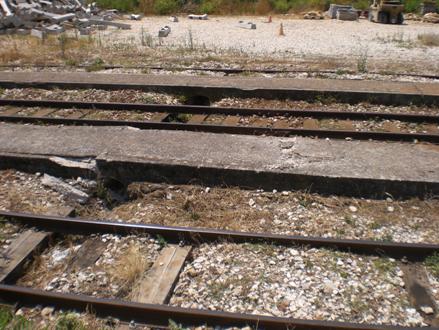
Figure 4.4. Photograph of compression features in concrete platforms. Marked as Photo b in Figure 4.2.
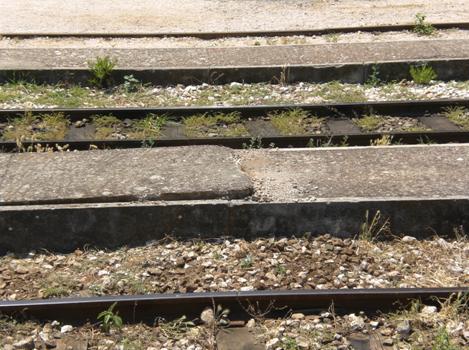
Figure 4.5. Photograph of compression features in concrete platform near west end of station. Marked as Photo c in Figure 4.2.
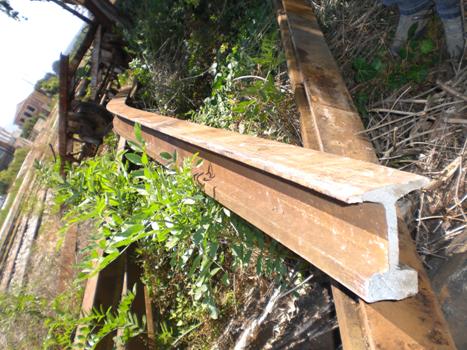
Figure 4.6. Photograph of deformed rail sections removed from service following earthquake.
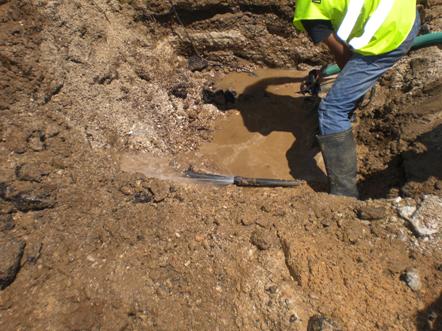
Figure 4.7. Photograph of leaking PVC water pipe on Apostolou Andreou Street south of train station site (N 38 deg 08.725', E 21 deg 33.691')
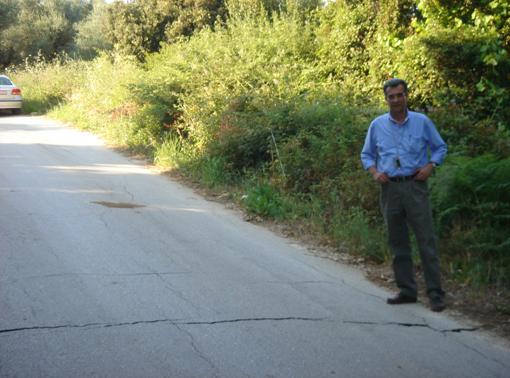
Figure 4.8. Fissures on road pavement between Peta and Mataraga

Figure 5.1. Map showing locations of features described in this chapter.
 |
|
Figure 5.2 Santomeri village: general view of the limestones hanging over flysh |
|
|
Figure 5.3. Santomeri village: location of the detached rock block that toppled (left side) - the rock block itself (volume 6 to 7 cubic meters) that caused severe structural damage at one of the houses of the village (right side)
|
|
|
Figure 5.4. Portes village: general view of the limestones (left side) and rock blocks (<0.5 cubic meters) that toppled down to a flat area over the village (right side) |
Figure 5.5. Landslide in marl and sandstone deposits along the road from Portes to Valmi village (direction N-S), in the near-field area. A general view is presented in the left part, where location of detached rock blocks are recognized as well as the scree deposits formed at the mild slope. Detachments were favored by subvertical joints paralel to the slope face. A detached rock block of estimated volume of 2 cubic meters, rolled down the hillslope and crossed the road (right part of the figure).
Figure 5.6. Toppling failures of upper relatively harder strata (marly sandstones) crossed by subvertical joints along the road from Portes to Valmi village (direction N-S). Close (left) and general (right)
|
Figure 5.7. Sliding of marl strata along bedding planes and joints dipping towards the road. National road near Kato Ahaia. Westward and Eastward view. |
|
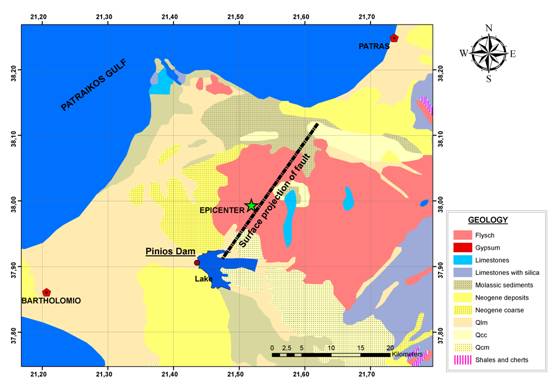
Figure 6.1. Location map for Pinios dam/reservoir
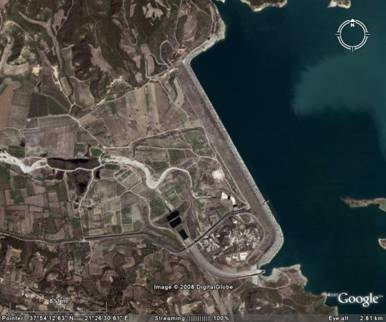
Figure 6.2. Plan view of Pinios dam and ancillary structures.
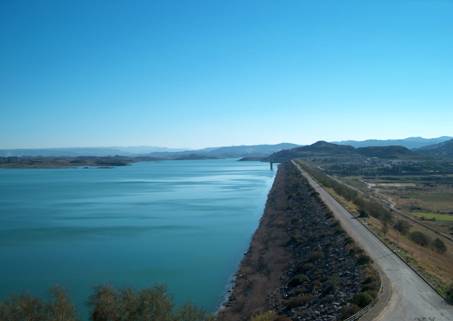
Figure 6.3. View of Pinios dam from the north abutment.
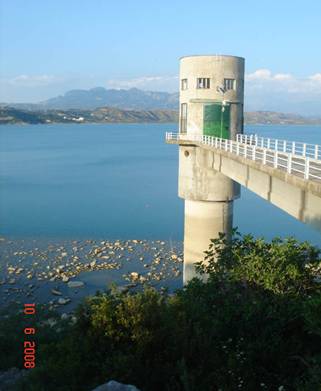
Figure 6.4. View of the outlet tower of Pinios dam.
Figure 6.5. View of the spillway of Pinios dam.
 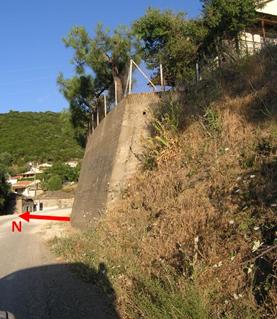
Figure 6.6. Cantilever type earth retaining walls (height? 4.5m) at Flokas village with no signs of distress (38 deg 02.000'N, 21 deg 38.000'E). Wall to left is approximately 4.5 m tall; to right wall height is approximately 3.5 m.
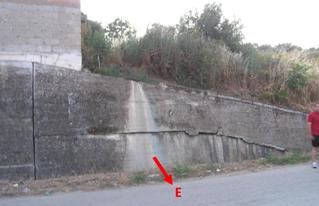 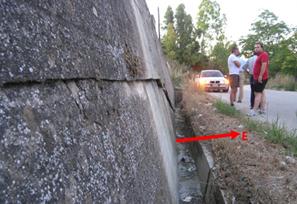
Figure 6.7. Gravity type earth retaining wall (height< 2.5m) at Agiovlasitika village (38 deg 7.354'N, 21 deg 33.821'E), which was damaged from the June 8, 2008 earthquake.
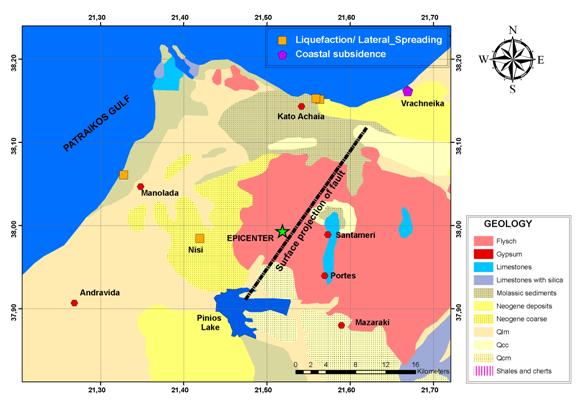
Figure 7.1. Map of north-western Peloponnese showing locations of liquefied sites, lateral spreading and coastal subsidence
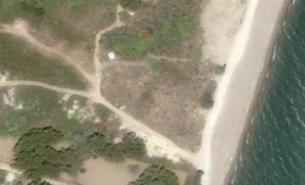
Figure 7.2. Vicinity map, surveyed site plan, and crack inventory for lateral spread referred as eastern site
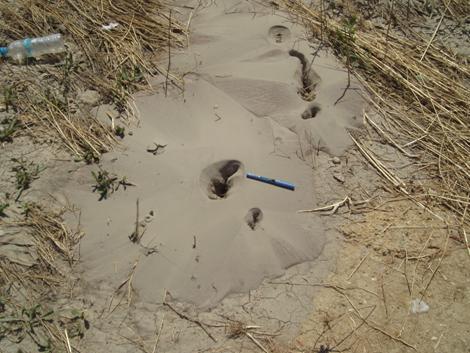
Figure 7.3. Boils with flows of grey coloured silty sand / sandy silt liquefied material
 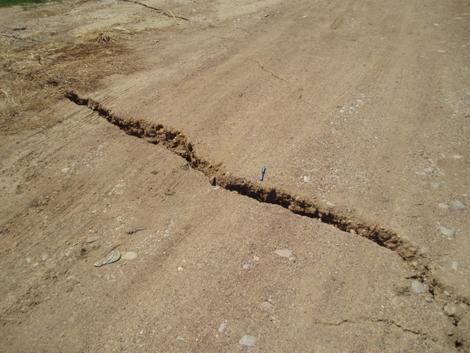
Figure 7.4. Crack attributed to lateral spreading effect (aperture H ~ 4 to 8cm,
drop V ~ 3 to 6cm)
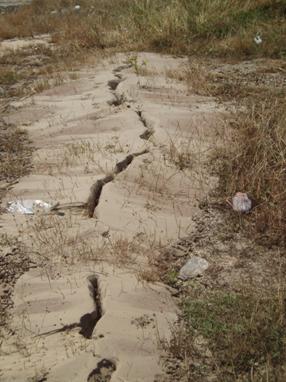
Figure 7.5. Cracks with flows of brownish, essentially sandy liquefied material
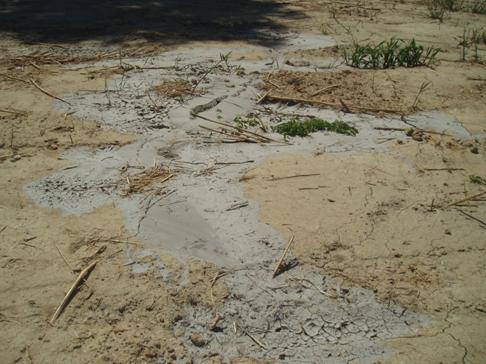
Figure 7.6. Cracks with flows of grey coloured silty sand / sandy silt liquefied material
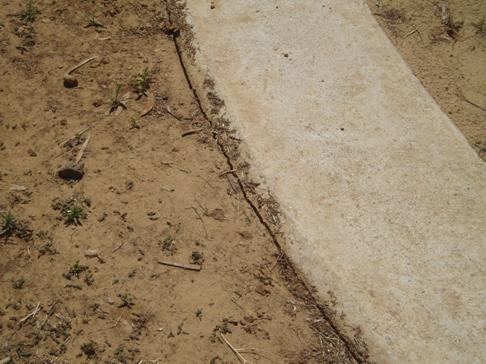
Figure 7.7. West part of Kato Achaia beach (minor cracks of maximum 1cm width)
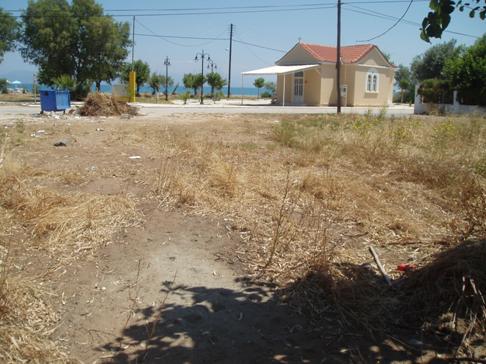
Figure 7.8. West part of Kato Achaia beach: sand boils of liquefied material
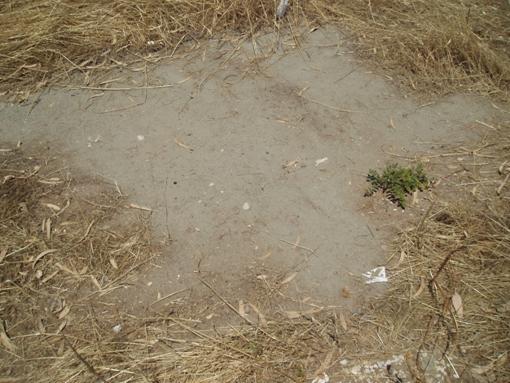
Figure 7.9. Detail of liquefied material at the west part of Kato Achaia beach

Figure 7.10. Map of ground cracking from coastal subsidence at two-story reinforced concrete structures in Vrachneika. Cracks without marked vertical offsets had zero observed vertical offset. Location: 38 deg10.375' N; 21 deg 40.543'
 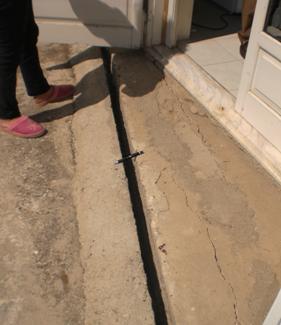
 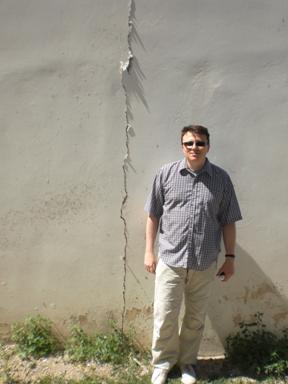
Figure 7.11. Photographs from site mapped in Figure 7.10. (a: top-left) wall cracking at two locations on west side of structure; (b: top-right) separation crack between foundation and surrounding ground at rear of structure; (c: bottom left) interior cracking of floor slab and tile with much smaller crack offsets than ground cracks at exterior; (d: bottom right) wall crack on east side of structure above floor slab crack from (c).
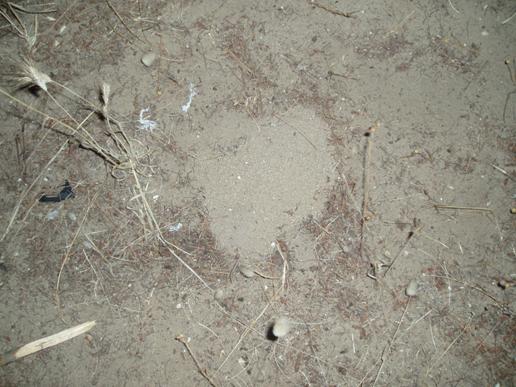
Figure 7.12. Detail of liquefied material (clean sand) at Manolada beach
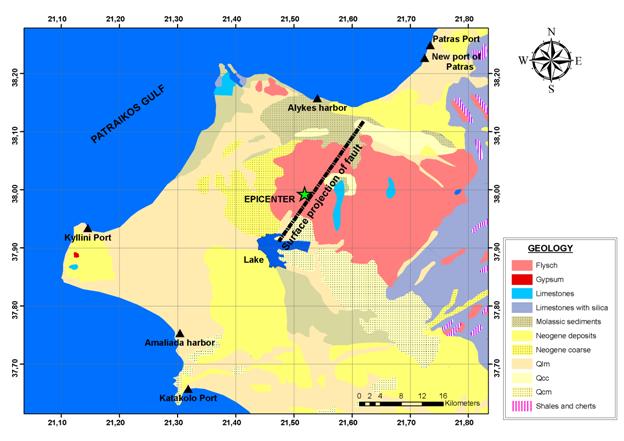
Figure 8.1. Location map with the major ports and harbors
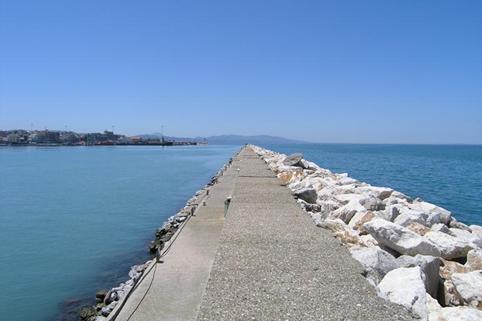
Figure 8.2. SW view of the Patras Port breakwater.

Figure 8.3. Typical cross-section (above sea level) of the Patras Port breakwater.
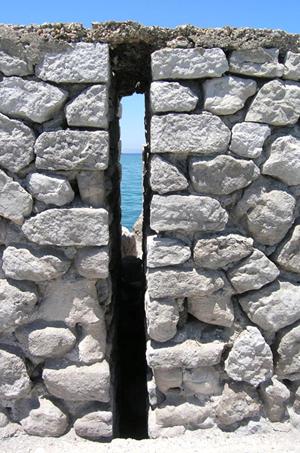
Figure 8.4. Separation (0.20m) between two consecutive segments of the breakwater. The concrete slab at the top bridges the gap between the consecutive segments.
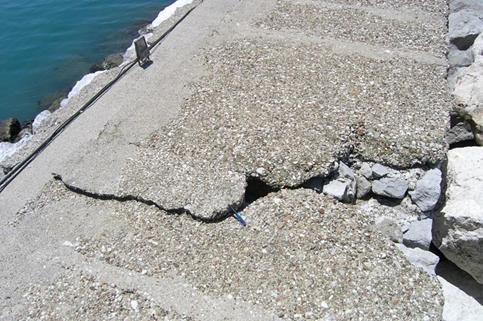
Figure 8.5. Signs of compression in the concrete slab overlying the masonry segments of the breakwater.
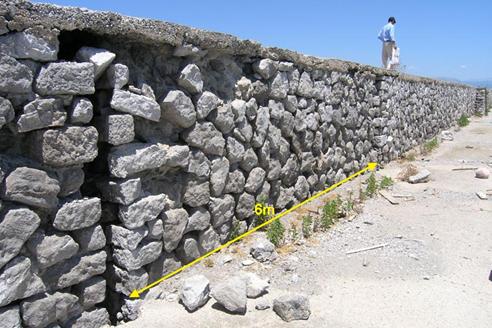
Figure 8.6. Detachment of stones from the landward face of one segment of the breakwater.
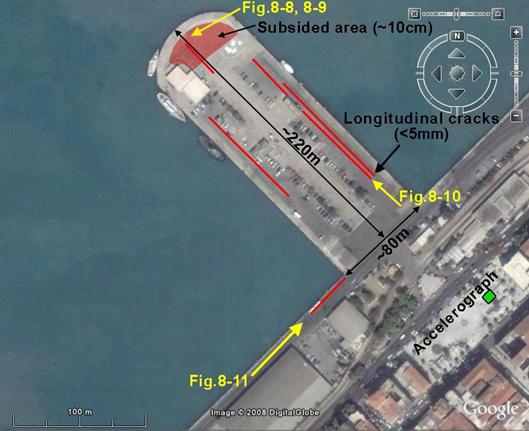
Figure 8.7. Plan view of the St. Nicholas mole with the locations of subsided area and cracks, with arrows indicating location and direction of shots shown in subsequent figures. The location of the University of Patras accelerograph at the Trion Symahon square is also depicted.
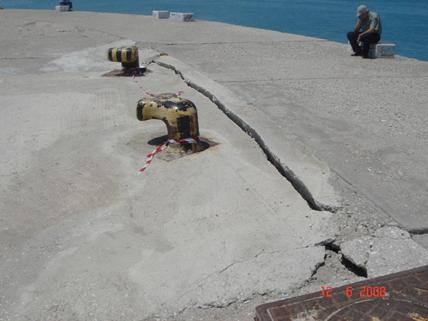
Figure 8.8. Subsided area near the end of the St. Nicholas mole.
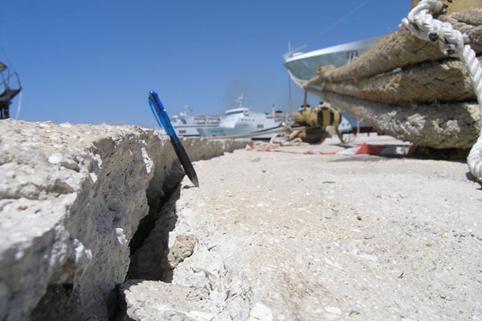
Figure 8.9. Detail of the subsided part of the mole, showing a vertical offset of about 0.10m.
Figure 8.10. Longitudinal cracks at the surface of the mole with a maximum width of about 5mm.
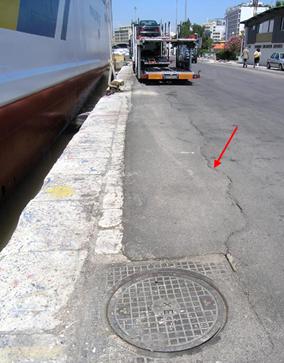
Figure 8.11. Cracks developed behind the quay wall at a small distance from the entrance of the St. Nicholas mole.
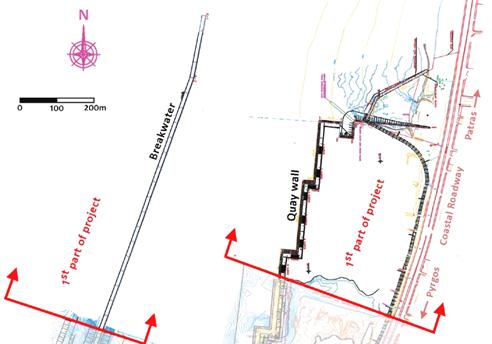
Figure 8.12. Plan view of the completed 1st part of the New Port of Patras.
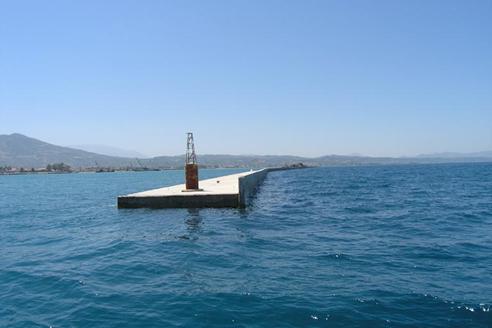
Figure 8.13. General view of the breakwater of the 1st part of the New Port of Patras.
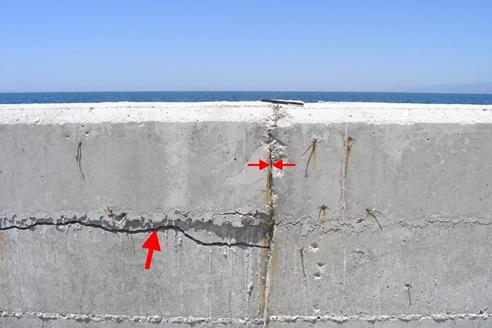
Figure 8.14. Signs of compression at a face wall joint of the breakwater.

Figure 8.15. Joint opening between adjacent caissons of the breakwater.
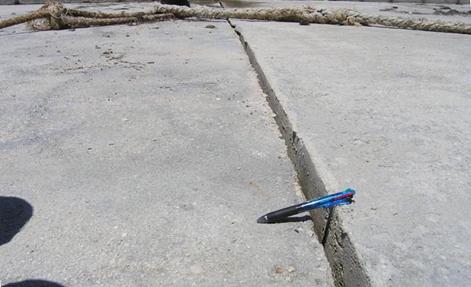
Figure 8.16. Differential settlement between two adjacent caissons of the breakwater.
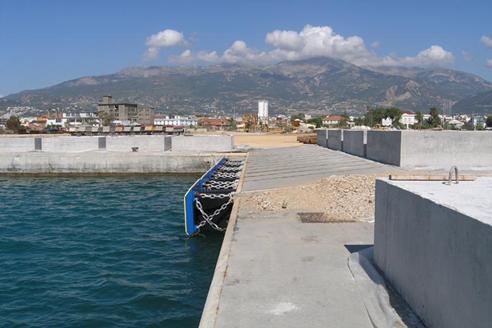
Figure 8.17. View of the (under construction) quay wall of the New Port of Patras.
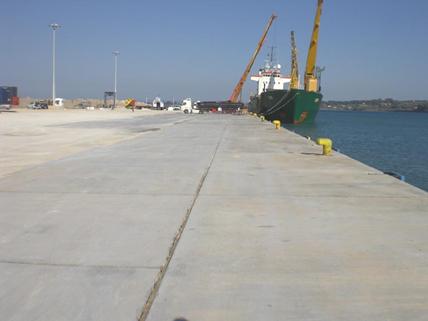
Figure 8.18. View of the quay wall at the Port of Kyllini.
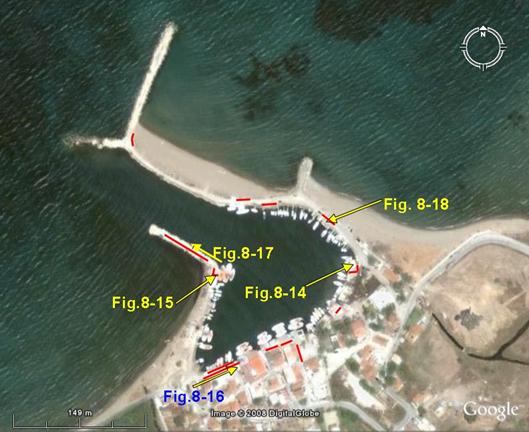
Figure 8.19. Plan view of Alykes (Kato Achaia) fishing harbor with arrows indicating location and direction of shots shown in subsequent figures.

Figure 8.20. Typical example of subsidence, rotation and seaward inclination of a quay wall in Alykes harbor.
Figure 8.21. Development of excessive cracking and joint opening (width of about 10cm), in quay wall at Alykes fishing harbor.
 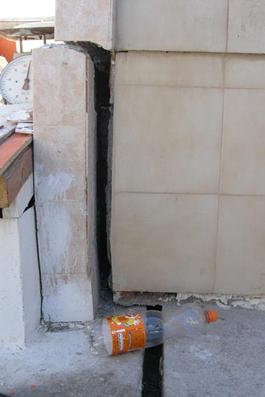
Figure 8.22. Development of separation crack between the foundation of a house and the surrounding ground (distance from the quay wall approximately 15m) in Alykes fishing harbor.
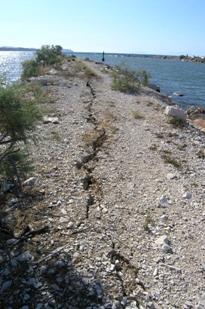
Figure 8.23. Development of surface cracking along the axis of a jetty at the Alykes fishing harbor.
Figure 8.24. Breakage and horizontal displacement of a small retaining wall due to cracking (and related soil displacement) of a jetty at the Alykes fishing harbor.
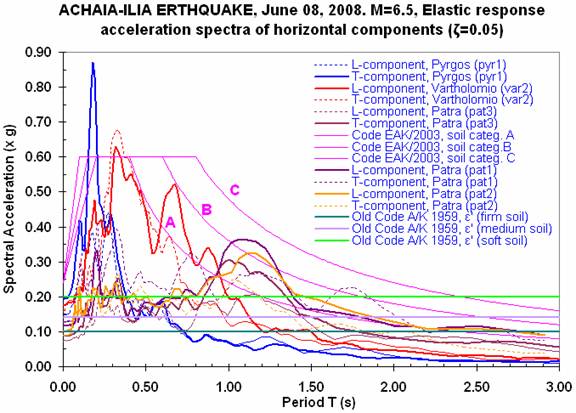
Figure 9.1. Response spectra of horizontal components of 8/6/2008 mainshock (5% damping) compared with elastic design spectra of the Greek Seismic Code (EAK2000) and the pre-1992 code (AK) provisions.
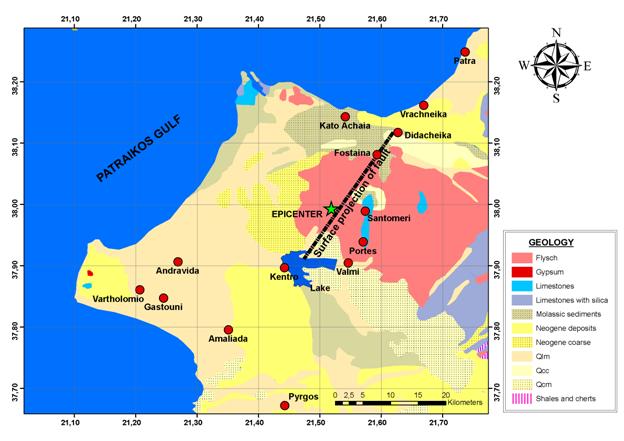
Figure 9.2. Urban areas visited by the team of Earthquake Engineers of ITSAK
Figure 9.3. (a)The instrumented building (b) uniaxial accelerometers of the recording system (c), (d) samples of records of a M=3.9 aftershock at two channels
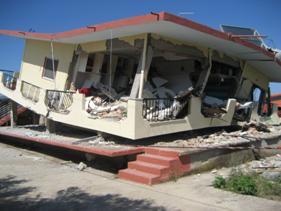
Figure 9.4 . Didacheika village. Collapse of a two-storey r/c building. |
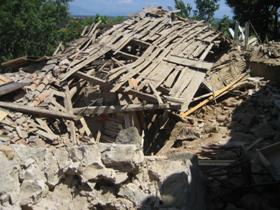
Figure 9.5. Fostaina village. Total collapse of a single-storey masonry building.
|
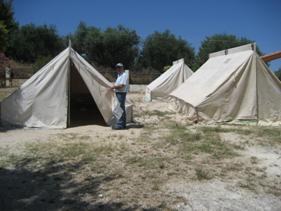
Figure 9.6. Fostaina village. Temporary accommodation.
|
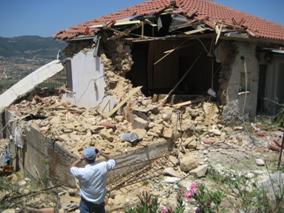
Figure 9.7. Santomeri village. Partial collapse of masonry walls due to boulder fall.
|
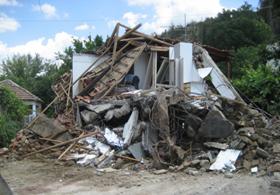
Figure 9.8. Valmi village. Total collapse of masonry building.
|
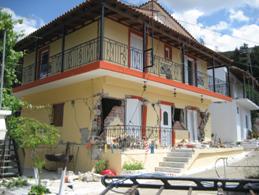
Figure 9.9. Valmi village. Severe cracks at a two-storey masonry building.
|
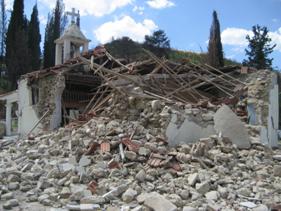
Figure 9.10. Valmi village. Total Collapse of a masonry Church building.
|
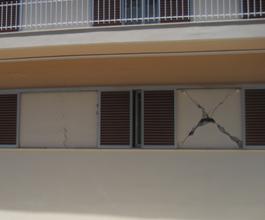
Figure 9.11. Amaliada town. Cracks at the infill masonry walls of r/c buildings.
|
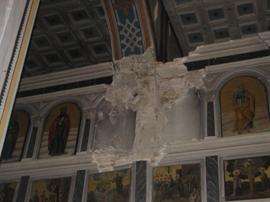
Figure 9.12. Amaliada village. Cracks at masonry arch of Agios Athanasios Church.
|
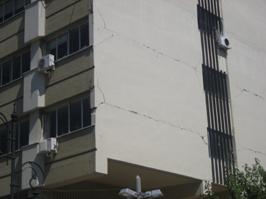
Figure 9.13. Pyrgos town. Infill wall cracks at the prefecture building.
|
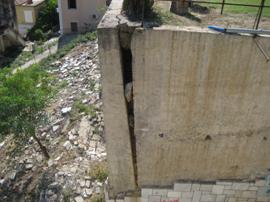
Figure 9.14. Pyrgos town. Horizontal displacement of R/C ground-supporting wall.
|
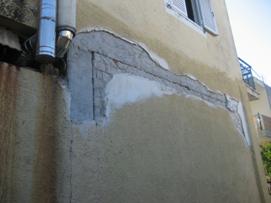
Figure 9.15. Vartholomio village. Detachment of infill masonry walls from r/c frame.
|
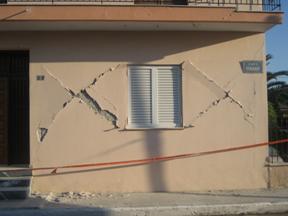
Figure 9.16. Andravida village. Cracks at the infill masonry walls in Stafidokampos area.
|
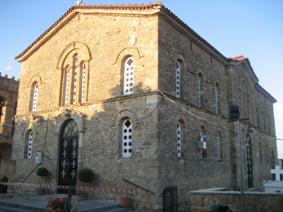
Figure 9.17. Andravida village. Cracks at upper area of a masonry church in the Strousi area.
|
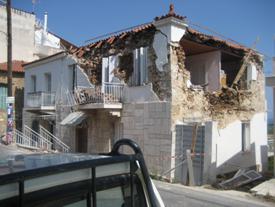
Figure 9.18. Kato-Achaia village. Partial collapse of masonry building.
|
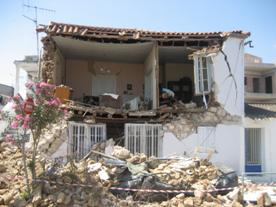
Figure 9.19. Kato-Achaia village. Partial collapse of masonry building.
|
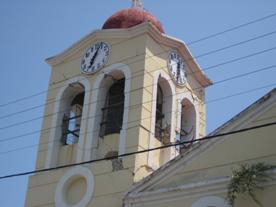
Figure 9.20. Vrachneika village. Cracks at the masonry bell tower of church.
|
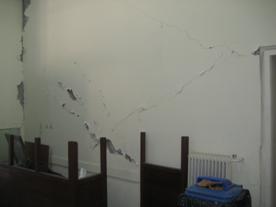
Figure 9.21. Patra town. Infill wall cracks at the Customs building in the port area.
|
References
Anagnostopoulos S.A., D. Rinaldis, V.A. Lekidis, V.N. Margaris, N. Theodulidis. (1987). The Kalamata, Greece earthquake of September 13, 1986. Earthquake Spectra, 3(2), 365-402.
Benioff, H. (1955). Mechanism and strain characteristics of the White Wolf fault as indicated by the aftershock sequence. In: "Earthquakes in Kern County, California, During 1952". Calif. Dept. Nat. Res. Div. Mines, Bull., 171, 199-202.
Benioff, H. (1962). Movements on major transcurrent faults. " Continental Drift", International Geoph. Ser. Academic Press, New York, 3, 103-134.
Boore, D.M. and G.M. Atkinson (2008). "Ground motion prediction equations for the average horizontal component of PGA, PGV, and 5%-damped PSA at spectral periods between 0.01 and 10.0 s," Earthquake Spectra, 24, 99-138.
Boore, D.M. and J.J. Bommer (2005). Processing of strong motion accelerograms: needs, options, and consequences, Soil Dyn Eqk. Engrg., 25, 93-115.
Chatzipetros, A., Valkaniotis, S., Papathanassiou, G., Sboras, S., Neofotistos, P., Mavrodis, P., and Pavlidis, S. (2008). "Quick report on the surface effects of the June 8, 2008 NW Peloponnese earthquake," Dept. of Geology, Aristotle University of Thessaloniki, Greece.
Danciu, L. and G-A. Tselentis (2007). Engineering ground-motion parameters attenuation relationships for Greece, Bull Seism. Soc. Am. 97, 162-183.
Doutsos, T. and G. Poulimenos (1992). Geometry of active faults and their seismotectonic significance in the western Corinth-Patras rift (Greece). J. Stuct. Geol., 14, 689-699.
Gzovsky, M.V. (1962). Tectonophysics and earthquake forecasting. Bull. Seism. Soc. Am., 52, 485-505.
Hatzfeld, D., G. Pedotti, P.M.Hatzidimitriou, and K Makropoulos (1990). The strain pattern in the western Hellenic arc deduced from a microearthquake survey. Geophys. J. Int., 101, 181-202.
Hatzfeld, D., G. Pedotti, P.M.Hatzidimitriou,D.G. Panagiotopoulos, E.M. Scordilis, I. Drakopoulos, K. Makropoulos, N. Delibasis, I. Latoussakis, I. Baskoutas and M. Frogneux (1989). The Hellenic subduction beneath Peloponnese, first results of a microearthquake study. Earth and Planetary Science Letters, 93, 283-291.
Karakostas, B.G., E.E. Papadimitriou, D. Hatzfeld, D.I. Makaris, K.C. Makropoulos, D. Diagourtas, Ch. Papaioannou, G.N. Stavrakakis, J. Drakopoulos and B. C. Papazachos (1994). The aftershock sequence and focal properties of the July 14, 1993 (Ms=5.4) Patras earthquake. Bull. Geol. Soc. Greece, XXX, 167-174
.
Kiratzi, A.A., G.F. Karakaisis, E.E. Papadimitriou and B.C. Papazachos (1985). Seismic source-parameter relations for earthquakes in Greece. Pure Appl. Geophys., 123, 27-41.
Kokkalas, S., Xypolias, P., and Koukouvelas, I. (2008) Surface ruptures of the recent Mw 6.3 (June 08, 2008) earthquake event in the northwestern Peloponnese: a preliminary field report. Laboratory of Structural Geology & Tectonics, Department of Geology, University of Patras, Greece
Koukouvelas, I., A. Mpresiaka, E. Sokos and T. Doutsos (1996). The tectonic setting and earthquake ground hazards of the 1993 Pyrgos earthquake, Peloponnese, Greece. J. Geol. Soc. Lon., 153, 39-49.
Papazachos, B. and K. Papazachou (2003). The earthquakes of Greece, 3rd edition. Ziti Publishing Co., ThessalonikiGreece, 286 pp.
Papazachos, B.C., G.F. Karakaisis and P.M. Hatzidimitriou (1994). Further information on the transform fault of the Ionian sea. Proc. XXIV Gen. As. Europ. Seism. Com., Athens, 19-24, Sept. 1994, I, 387-384.
Papazachos, C.B. and A.A. Kiratzi (1996). A detailed study of the active crustal deformation in the Aegean and surrounding area. Tectonophysics, 253, 129-154.
Papazachos, B.C., Ch.A. Papaioannou, C.B. Papazachos, and A.S. Savvaidis (1999). Rupture zones in the Aegean region. Tectonophysics, 308, 205-221.
Rigo A., H. Lyon-Caen, R. Armijo, A. Deschamps, D. Hatzfeld, K. Makropoulos, P. Papadimitriou, I. Kassaras (1996). A microseismic study in the western part of the Gulf of Corinth (Greece): implications for large-scale normal faulting mechanisms, Geophys. J. Int., 141, 663-688.
Scordilis, E.M., G.F. Karakaisis, B.G. Karakostas, D.G. Panagiotopoulos, P.E. Comninakis and B.C. Papazachos (1985). Evidence for transform faulting in the Ionian Sea. The Cephalonia island earthquake sequence of 1983. Pure Appl. Geophys., 123, 388-397.
Skarlatoudis, A.A., C. B. Papazachos, B. N. Margaris, N. Theodulidis, Ch. Papaioannou, I. Kalogeras, E. M. Scordilis, and V. Karakostas (2003). Empirical peak ground-motion predictive relations for shallow earthquakes in Greece. Bull Seism. Soc. Am. 93, 2591-2603.
[back to table of contents]
Acknowledgments
Partial support for this work came from the Institute of Engineering Seismology and Earthquake Engineering (ITSAK - YPEXODE). The participation of Jonathan Stewart was enabled by EU research project number ITSAK.GR, MTKD-CT-2005-029627. Elena Zargli is thanked for her excellent and timely work on preparing GIS ebase maps for this report. ITSAK technical staff (N. Adam, A. Marinos and E Vorrias, Electrical Engineers and P. Kyriazidis, driver) also performed invaluable tasks during the actual reconnaissance work, and we thank them sincerely. Local facility owners and operators are thanked for allowing the installation of temporary seismometers for aftershock monitoring.
We would also like to thank the Ministry of Environment Physical Planning & Public Works of Greece, EYDE/MEDE Division as well as the Patras Port Authority, SA. We thank Professors Stavros Anagnostopoulos and Stathis Stiros of the University of Patras for their assistance. We also thank Civil Engineers Ms Lena Kanakari, Mr. Sotiris Lykourgiotis, Dr. Makis Moulinos, Ms Eleni Pefani, Mr Panos Psimoulis, and Ms Elli Zisimatou and Mechanical Engineer Mr. Panagiotis Mantzoufas, who helped in the compilation of information and provided some of the eyewitness accounts of earthquake effects described here. We appreciate the work of Ben Mason, who prepared the html files for web posting.
Support for the web posting of this report was provided by the U.S. National Science Foundation-sponsored GeoEngineering Earthquake Reconnaissance (GEER) Association through NSF Grant CMMI-00323914. Any opinions, findings, and conclusions or recommendations expressed in this material are those of the authors and do not necessarily reflect the views of the National Science Foundation
|