2.0 Earthquake Setting and Source Characteristics
2.1 Geological and Tectonic Setting
a. Geodynamic evolution
The area affected by the earthquake of April 6, 2009 is located within the central section of the Apennines. This mountain chain, which traverses most of the length of the Italian peninsula, is the result of the convergence between the African and European tectonic plates and the subsequent collision of the two continental margins, a geodynamic process illustrated in Figure 2.1 that began in the Neogene age (about 23 MY before present) and was responsible for the closing of the Mesozoic Tethys Ocean.
Figure 2.1. Geodynamic model for the central Mediterrannean (Devoti et al., 2008)
The compressive phase significantly deformed the extensive layers of marine deposits accumulated along the margins of the African Plate, uplifting them into a mountain chain. Over time, orogenic thrusts acted in an asynchronous manner along the Apennine chain, deforming this sector of the continental crust from the Miocene epoch to the Upper Pliocene sub-epoch (24 My to 3.6 My BP).
The geodynamic model most often cited and used to describe recently observable phenomena is based on a thrust belt-foredeep-foreland system progressively migrating away from the Tyrrhenian and towards the Adriatic flank. As schematically depicted in Figure 2.2, this system describes a transition from continental compression in the front of the chain (Adriatic side) to extension behind the chain (Tyrennian sector).
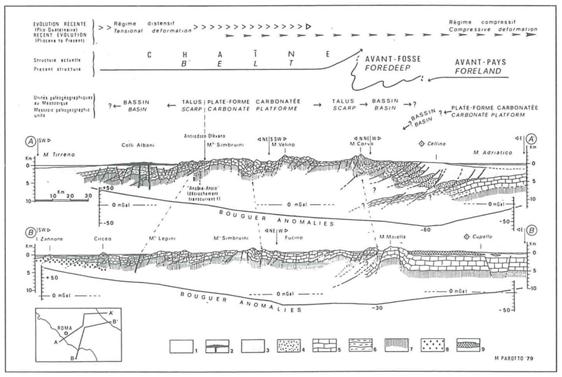
Figure 2.2. Geologic cross-sections across the central Apennines. The area affected by the earthquake is located between M. Velino and M. Grande (Tozzi, 1993 from Parotto, 1980).
Most of the central zone of the Apennine chain is formed of stiff calcareous successions of carbonate platforms and turbiditic deposits that were deposited in the foredeep basins and progressively incorporated in the chain migrating from West to East. The deposits were folded and faulted. The older deposits overlie more recent ones, indicating the formation of an orogenic structure known as a tectonic duplex. The resulting effect is characterized by significant crustal shortening, some of which is evident in this segment of the Apennine chain. Furthermore, later structural complications contributed to the rotation of rigid blocks and isostatic movements in response to strong crustal thickening. At a certain point the chain emerges from the seabed, rising in some places to peaks higher than 3000 m above sea level. The emergence of the chain would have begun at the end of the Messinian age (7 My BP; in the more internal, Tyrrhenian sectors) and continued until the Upper Pliocene epoch (3.6 My BP; for the more external, Adriatic sectors) (Cavinato and De Celles, 1999). A map of the portion of the Apennine chain near L'Aquila is shown in Figure 2.3.
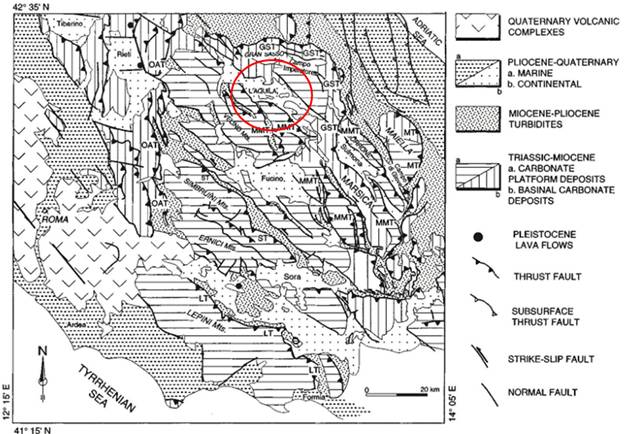
Figure 2.3. Geologic-structural map of the central Apennines (Cavinato and De Celles, 1999). In the L'Aquila basin (inside the red circle) there are continental Quaternary deposits (in white with black dots) encased between carbonate platform deposits (horizontal and vertical hatching lines).
The thrust belt-foredeep-foreland system's progressive migration towards the Adriatic flank would have occurred in response to a mechanism of sinking with the flexural retreat of the Apulian foreland plate. The flexural retreat could be attributed to the existence of movements in the upper mantle that have a direction contrary to that of the subduction of the Apulian plate towards the Tyrrhenian flank (Doglioni, 1990 and 1991).
Finally, beginning in the Messinian-Tortonian age (11.6 My BP) the area experienced a process of crustal thinning accompanied by the oceanization of the Tyrrhenian Sea (retroarc basin). Since the Lower Pleistocene (1.8 My BP), these extensional movements, which in the peri-Tyrrhenian area cause the development of Tuscany-Lazio-Campania volcanism, have been progressively migrating towards the Adriatic sectors, to the point that they have affected the Apennine chain's watershed. However the portion of the chain between the watershed and the Adriatic area would have undergone a process of gravitational settling and collapses due to isostatic instability, with the consequent formation of several intra-Apennine basins, including the L'Aquila basin (Ghisetti and Vezzani, 2000 and 2002).
The deformations associated with crustal thinning and the gravitational collapse are primarily accommodated by normal faults formed in part by reactivating pre-existing thrusts associated with the emplacement of the Apennine tectonic slices, making these structures important pre-, syn- and late-orogenic normal features that define the plano-altimetric configuration (basin and range). This pattern displays alternating ridges (Simbruini-Ernici, Velino-Sirente, Gran Sasso, Maiella e Morrone, etc.) and depressions under tectonic control (Valle del Sacco, Val Roveto, Piana del Fucino, Valle dell'Aterno, Conca dell'Aquila, Piana di Sulmona, etc.) as illustrated in Figure 2.3 (Cavinato and De Celles, 1999).
The foredeep of the tectonic system described above extends with a sort of geographic continuity from the great Padan Plain down to the Bradanic area (Puglia) and encompasses thousands of meters of silico-clastic sediments. The compression is active in the Adriatic coastal area.
b. Geological Setting
The central sector of the Apennine chain consists of deposits that were formed on the continental crust of the African plate in different paleogeographic domains. In general terms two great Meso-Cenozoic depositional systems are distinguishable. The first is characterized by Mesozoic carbonate platforms (limestones and dolomites) evolving towards carbonate slope and basin environments (calcarenites and marls) and was subject to active deposition until the mid-Miocene (16.5 My BP). The second consists of impressive foredeep silico-clastic deposits (clays and sandstones) datable to the Upper Miocene-Pliocene interval (11 to 5 My BP).
The emergent chain then underwent an intense erosive Plio-Pleistocene phase (5 to 1.7 My BP). The sedimentary erosive-depositional cycles produced slope deposits and vast alluvial and lacustrine deposits that filled the intra-Apennine basins. The Pleistocene glacial cycles interacted with the tectonic deformations, through fluctuations in fluvial base level and variations of the predominant morphodynamic regime. Figure 2.4 shows a distribution of the Quaternary deposits present within the L'Aquila basin and the Aterno River Valley, which comprises the principal hydrographic feature of this sector.
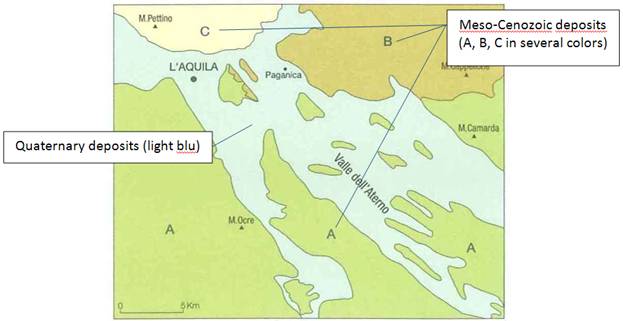
Figure 2.4. Distribution of Quaternary deposits (in light blue) and Meso-Cenozoic deposits (in other colors) in the L'Aquila basin and the Aterno River Valley (from Sheet no. 359 of the Geologic Map of Italy at scale of 1:50000 - APAT, 2006).
Elongation in the NW-SE direction (parallel to many of the active normal faults) is notable in these intra-Apennine basins, which include the localities -- among them the city of L'Aquila -- that were affected by the earthquake of April 6.
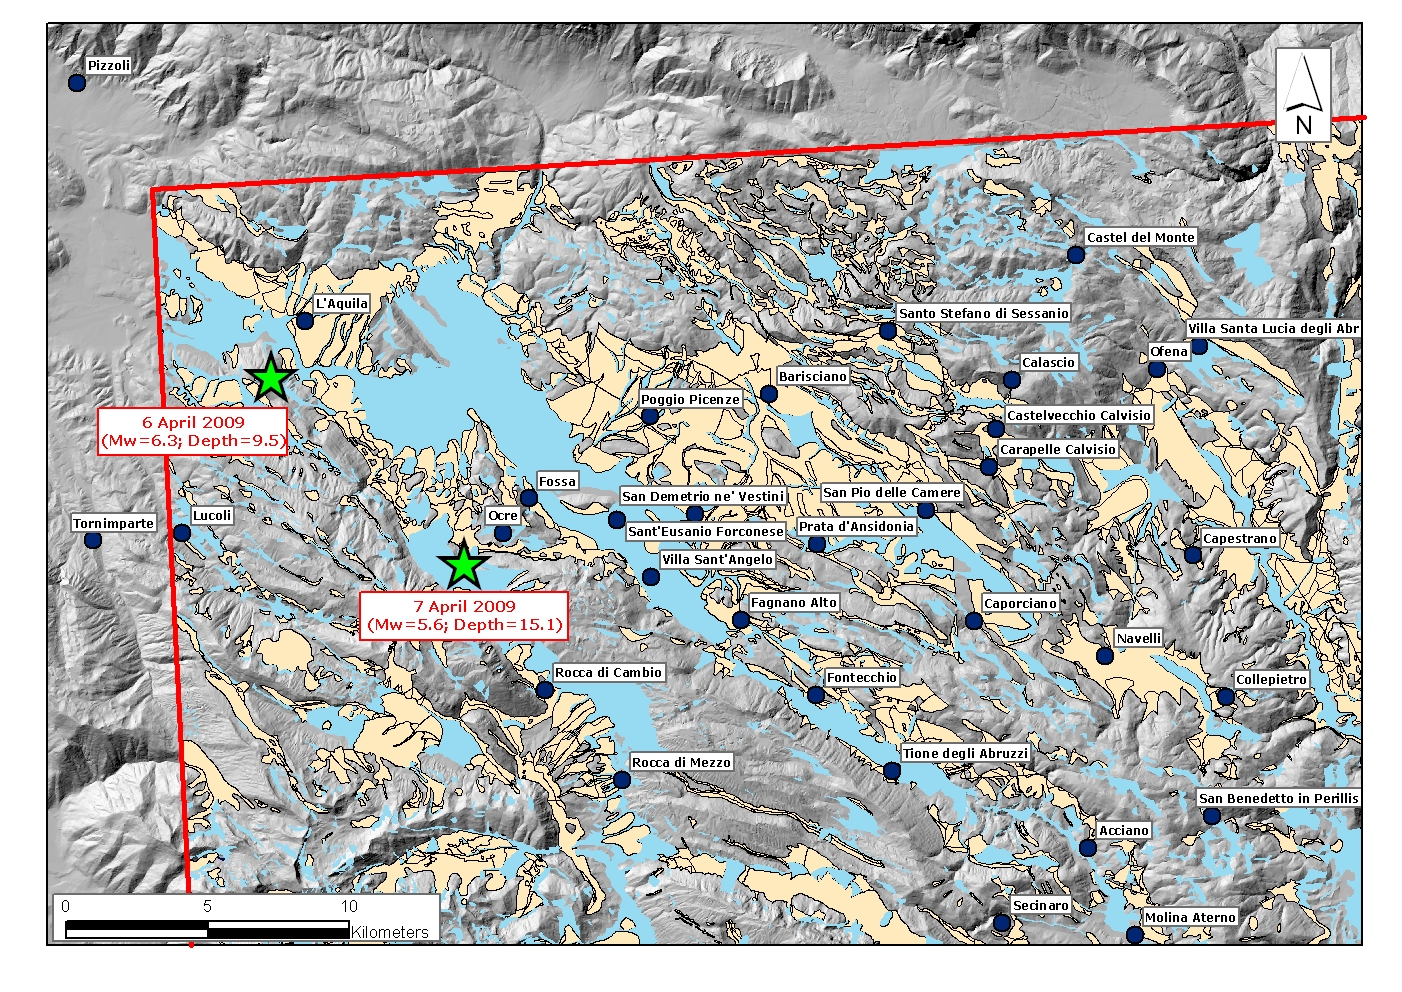
Figure 2.5. Detail of the L'Aquila area. Within the red line, the areas in gray are where the Meso-Cenozoic deposits outcrop. The Pleistocene deposits are in beige, and the Holocene deposits are in light blue.
Figure 2.5 is a detail of Figure 2.4 in the L'Aquila area, showing the outcropping Meso-Cenozoic carbonate rocks (with a small part of Meso-Cenozoic marly-arenaceous rocks just east of L'Aquila) along with Quaternary sediments distinguished as Pleistocene (beige) or Holocene (light blue).
The area that was most intensely affected by the April 6 mainshock roughly corresponds to the valleys of the Aterno River, its right tributary Raio Creek and the plateau extending to the west of the Aterno Valley. The bedrock of the area is comprised of limestone formations, deposited from the Jurassic to the Miocene age, that largely outcrop along the valley flanks and on the ridges located within the Aterno Valley. These limestones (shown in green on the cross sections in Figures 2.6 and 2.7) vary in texture from micritic to bioclastic and calcareous sandstones are also common. Several formations are associated with thick chert bands and/or layers. Glauconite rich layers are found in several of the Cretaceous formations. Bedding thickness ranges from thinly bedded to very thickly bedded massive limestones. The pelagic content of the limestone varies and several formations vary between marly limestone and calcareous marls, which tend to be thinly bedded. Calcareous conglomerates form the thickest and most competent layers within these formations. Locally the substratum consists of Miocene sandstones with marly intercalations. These outcropping formations (shown in light brown to dark brown in Figure 2.6) are composed primarily of marls and clays. Marl-dominated formations also tend to be thickly bedded, within these formations the clay content can vary resulting in more clayey marls. Marly limestones are also present in these formations together with chert and glauconite.
In the central inhabited zone of L'Aquila there are vast deposits associated with Quaternary paleolandslides. These deposits are comprised of Pleistocene heterometric breccias with varying degrees of cementation, known as "Megabreccias", at times of noteworthy dimensions (up to several cubic meters), comprised of primarily calcareous elements immersed in sandy silty matrices (Blumetti et al., 2002).
According to Bertini and Bosi (1970, 1989) the Aterno Valley is partly filled by Pleistocene lacustrine deposits formed by a complex sequence of pelitic and coarse grained units, with frequent lateral variations, overlying the bedrock. On the left side of the Aterno river drainage basin (drainage from NW to SE), old breccias with large blocks are interposed between the bedrock and the lacustrine sequence (Valle Valiano formation).
The older (bottom) unit of the lacustrine sequence is the S. Nicandro formation. It consists of silts locally characterized by a significant clay fraction. On the left side of the drainage basin, alternations of silts with breccia layers are locally found at the base of the lacustrine sequence.
More recent (shallower) components of the lacustrine sequence are formed by coarse-grained units, often cemented, ranging from sands with gravels to breccias with large blocks, which can present finer intercalations (silts, fresh or weathered pyroclastites, paleosols). The units differ by clast shape, abundance of finer intercalations and overall degree of cementation.
The valley bottom is topped by Holocene alluvial deposits whereas the foot of the valley flanks and of the ridges located within the valley are covered by talus debris and locally by large debris alluvial fans.
c. Tectonic Setting
The Quaternary deposits of the L'Aquila area were deposited in morphological depressions inside the uplifted and emergent chain. These sedimentary basins are primarily delimited by high-angle (70deg) normal faults with an Apennine trend that vertically break up, at different elevations, the orogenic structure, thereby forming a Horst and Graben structure. The normal fault system has its origins in a Quaternary phase (1.8 My BP). In general, the intra-chain basins are delimited by master faults and synthetic faults (i.e., a type of minor faults whose strike and sense of displacement is similar to their associated major fault) on the eastern sides of the depressions and by antithetic faults on the western sides.
In the area southeast of L'Aquila it is possible to see morphological limestone ridges outcropping with monoclinalic attitude. Some ridges are located in the center of the old Quaternary lacustrine basin. These ridges are the surface evidence of uplifted structures (Horst wedges) surrounded by depressed areas (Grabens) filled with Quaternary deposits.
Figure 2.6 shows a geologic cross-section that cuts from SW to NE through the Aterno Valley, taken from the Geologic Map of Italy at scale 1:50000; this section gives an idea of the tectonic structure of this sector. The right side of Figure 2.6 shows an intra-Apennine basin alongside an area of the chain that was overlain during the compressive phases by Apennine orogeny. If the cross-section were to extend towards the right it would include the high reliefs of the Gran Sasso, bordered in turn by normal faults that lower the carbonate platforms towards the Southwest. The cross-section coincidentally crosses the L'Aquila basin at the elevation of Onna, a severely damaged village.
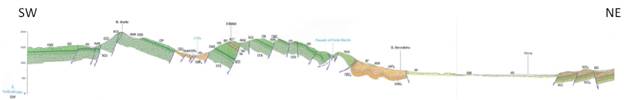
Figure 2.6. SW-NE Geologic cross-section, crossing the L'Aquila basin and passing through the inhabited center of Onna, where the highest macroseismic level was surveyed (X MCS) (from the Geologic Map of Italy at scale 1:50000)
Figure 2.7 shows another geologic cross-section (SW-NE) at scale 1:25000, across the Quaternary basin. The carbonate ridges (Horsts) in green form the rigid substrate overlain by Quaternary deposits (in other colors) that fill the morphologic depressions (Grabens). The limestone ridges, with a generally NW-SE trend, are bounded by normal faults that lower them at various elevations.
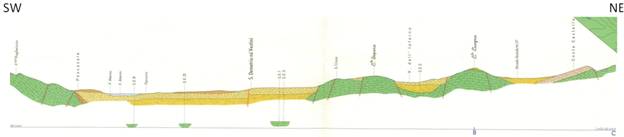
Figure 2.7. SW-NE Geologic cross-section of the Aterno River Valley (Bosi and Bertini, 1970).
The extensional system comprised of normal faults (master faults, synthetic and antithetic faults) present in the area is active, as demonstrated by this earthquake and the regional geomorphology. As described below in Section 2.2, extension is also demonstrated by the normal fault focal mechanism of the present earthquake. The activity of the tectonic structures, with larger movements on the eastern edges of the basins, are also evidenced by the presence of important Quaternary alluvial fans on the Northeast side of depressions. With their movement the normal faults have in fact produced a rejuvenation of the relief in the NE areas, resulting in the increased effectiveness of the erosive processes and the deposition of coarse material in the valley zones in the SW areas. Figure 2.8 indicates the active faults of the L'Aquila area. These are normal faults of variable length that predominantly strike NW-SE (Bagnaia et al., 1992; Bonocio et al., 2004; Galadini and Galli, 2000; Galadini and Messina, 2001). Southeast of L'Aquila, the active faults have a strongly rectilinear trend dipping either towards the Southwest or the Northeast.
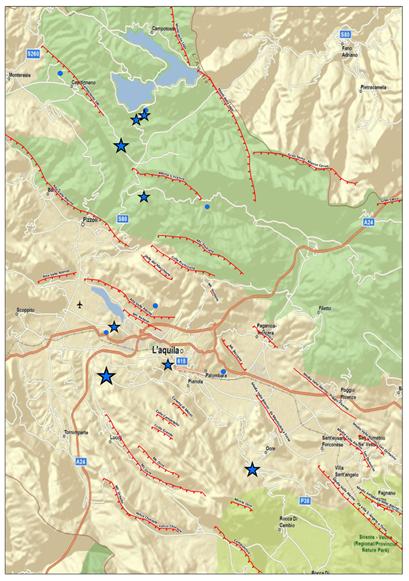
Figure 2.8. Active faults (in red) of the L'Aquila area (from INGV website: http://www.ingv.it). The features are oriented towards the hanging wall. The stars indicate the locations of some epicenters with Mw>4.0 associated with the recent seismic sequence.
2.2 Seismological Aspects (Seismo-Kinematic Characteristics and Macroseismic Studies)
a. Mainshock
The principal seismic event began on the 6th of April, 2009 at 01:32:39 (UTC) and was recorded by the centralized national seismological network Rete Sismometrica Nazionale Centralizzata, operated by the national earthquake center (Centro Nazionale Terremoti, CNT) of the National Institute of Geophysics and Volcanology (Istituto Nazionale di Geofisica e Vulcanologia, INGV, www.ingv.it). The parameters calculated for this earthquake are given in Table 2.1. The main shock coordinates and depth, reported in Version 1 of the GEER Report, have been revised per more recent results from INGV.
Table 2.1. Parameters for mainshock (in bold) and principal triggered events
Date |
Hour (UTC) |
Lat. (N) |
Long. (E) |
Depth (kM) |
Mw |
2009/03/30 |
13:38:38 |
42.326 |
13.362 |
10.6 |
4.4 |
2009/04/06 |
01:32:39 |
42.348 |
13.380 |
9.5 |
6.3 |
2009/04/07 |
17:47:37 |
42.275 |
13.464 |
15.1 |
5.6 |
2009/04/09 |
00:52:59 |
42.484 |
13.343 |
15.4 |
5.4 |
The focal mechanism shows that the event took place along a normal fault trending NW-SE (strike 147 deg) with dip SW < 50 deg, demonstrating the same direction as many of the major tectonic structures visible on the surface (Figure 2.8).
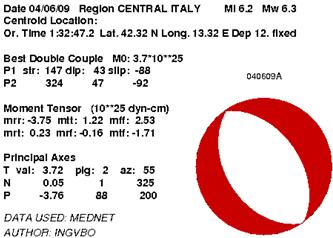
Figure 2.9. Rete Mednet: Quick Regional Centroid Moment Tensors for the earthquake of April 6, 2009 (http://earthquake.rm.ingv.it/qrcmt.php).
b. Seismic sequence
The earthquake of April 6, 2009 was the largest event in a seismic sequence that started a few months earlier and had its most significant previous event on March 30, 2009. The focal mechanism of this event is shown in Figure 2.10.
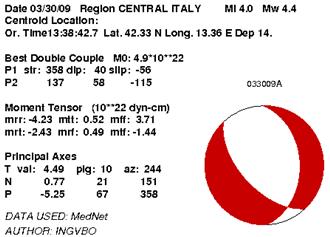
Figure 2.10. Rete Mednet: Quick Regional Centroid Moment Tensors for the earthquake of March 30, 2009 (http://earthquake.rm.ingv.it/qrcmt.php).
Since April 6th an active seismic sequence, not yet concluded, has occurred with events as large as Mw 5.6. Figures 2.11-12 show the focal mechanisms, and key attributes are given in Table 2.1.
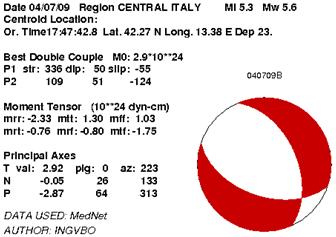
Figure 2.11. Rete Mednet: Quick Regional Centroid Moment Tensors for the earthquake of April 7, 2009 (http://earthquake.rm.ingv.it/qrcmt.php).
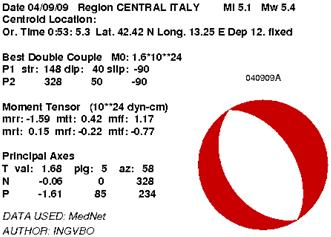
Figure 2.12. Rete Mednet: Quick Regional Centroid Moment Tensors for the earthquake of April 9, 2009 (http://earthquake.rm.ingv.it/qrcmt.php).
The instrument locations and the sequence of the aftershocks (Figure 2.13, updated on July 16, 2009) clearly identify two principal areas of crustal rupture: the main area in which the main shock of April 6 occurred and a second area associated with another tectonic structure, probably of lesser dimensions, on which the earthquake of April 9 occurred. Even the latter structure demonstrates that it had extensional movement along a plane oriented in the Apennine direction and dipping towards the SW by about 50 deg (Figure 2.12). The earthquake of April 7, whose focal mechanism also shows a component of oblique movement (Figure 2.11), occurred at a greater depth than the other two events. Both the April 7 and April 9 earthquakes are considered triggered events and not aftershocks of the April 6 mainshock.
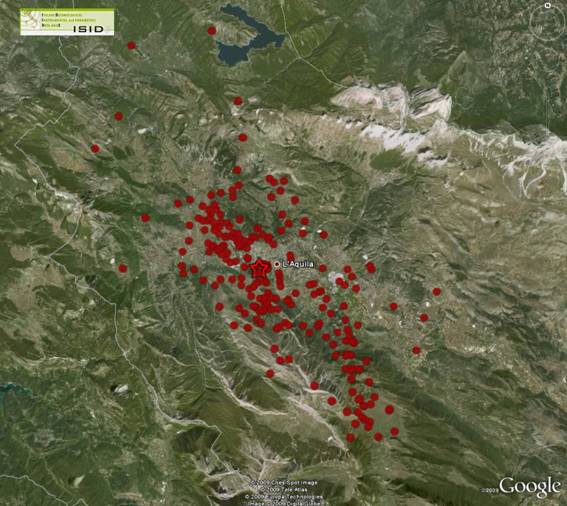 |
April 6, 2009
Epicenters for mainshock and aftershocks on 6 April |
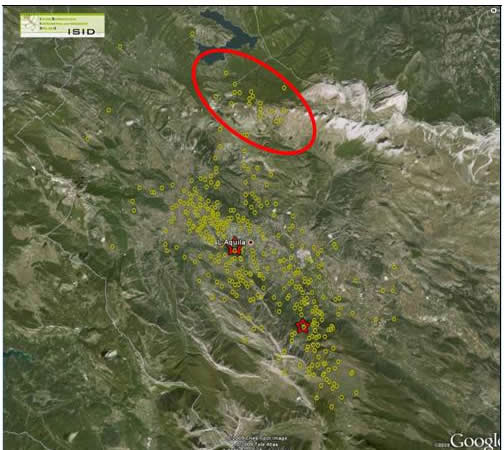 |
April 6-7, 2009
On April 7 new seismic events began to appear in the north of the area struck by the April 6 earthquake (towards Campotosto lake). A triggered event Mw=5.6 occurs SE of L'Aquila (red star) |
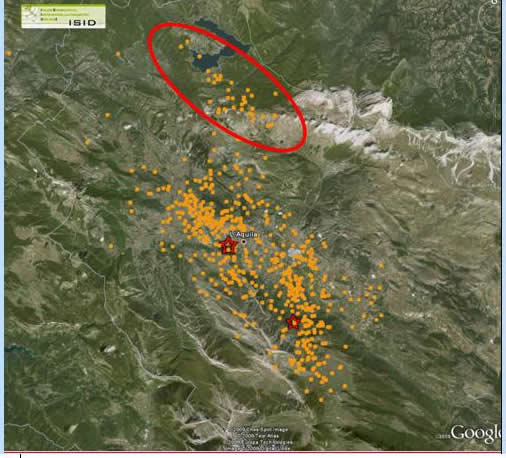 |
April 6-8, 2009
On April 8 seismicity near Campotosto Lake increases, with events oriented NW/SE. The seismic sequence near L'Aquila continues. |
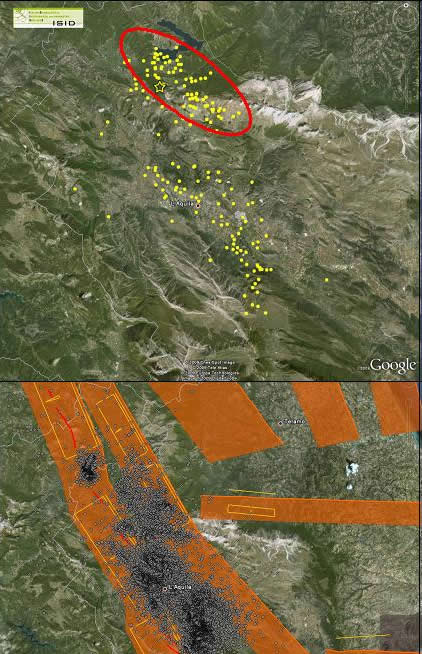 |
April 9, 2009
A second event is triggered near Campotosto Lake on April 9 at location marked with yellow star.
|
January 1 - July 16, 2009
Yellow boxes and lines denote individual sources and orange zones are composite sources from DISS Working Group (2009)
|
|
Figure 2.13. Seismic sequence in the L'Aquila area using data from ISIDE (Italian Seismological Instrumental and Parametric Data-Base: http://iside.rm.ingv.it/iside/standard/index/jsp). The locations of the epicenters were updated on July 16, 2009 (www.ingv.it). An animation of the time sequence of aftershocks is available at http://dl.getdropbox.com/u/164400/ABRUZZO/index.html
Figure 2.14 shows several transverse sections (sections 1, 2 and 3) and one longitudinal section (section 4) of the L'Aquila basin that illustrate hypocenter distributions. The sections also show the surface positions of the active faults expressed at the surface (Chiarabba and De Gori in Cocco, 2009). It should be noted that the hypocenter locations used in Figure 2.14 refer to a time interval in the seismic sequence previous to the one referenced in Figure 2.13, and therefore in Figure 2.14 several recent events are not shown.
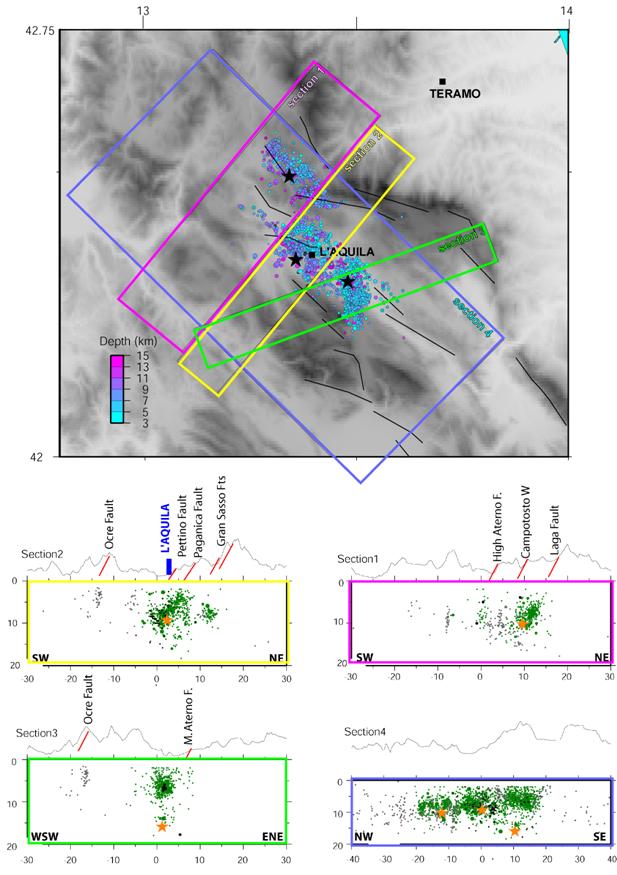
Figure 2.14. Seismic sequence in the L'Aquila area. Epicenter locations (at top) and sections showing hypocenter locations (Chiarabba and De Gori, in Cocco, 2009).
Section 4 shows a concentration of hypocenters between 5 and 10 km of depth. Note that the epicenters do not indicate the presence of seismic activity at shallow depth (upper 2-3 km). The stars indicate the three principal events of the sequence. The one in the center is the main shock. Left of the main shock is the hypocenter of the April 9 triggered event that occurred North of L'Aquila; on the right is the April 7 triggered event along the Aterno Valley (Southeast of L'Aquila), located at a depth of about 15 km in a crustal area with a cluster of minor events. The other sections show hypocenters of events occurring after the main shock, located at various depths progressing towards the surface and distributed primarily along inclined planes that have surface expressions in the traces of the active faults shown in Figure 2.15 (Bagnaia et al., 1992; Boncio et al. 2004; Galadini and Galli, 2000; Galadini and Messina, 2001). Section 2 shows an apparent dip of the ruptured fault, as evidenced from the hypocenter pattern, that is somewhat shallower than that of the surface-expressed faults. The other sections do not illustrate a dip angle sufficiently clearly to identify potential differences.
Figure 2.15. Active faults of the L'Aquila area and locations of the three principal events of the active seismic sequence (Emergeo Working Group, 2009). Mainshock epicenter coordinates not updated per Table 2.1.
In Figure 2.15, the purple triangles indicate waypoints where Emergeo geologists observed coseismic phenomena, particularly ground fractures and/or remobilization of the recent talus laid on the fault planes.
The earthquake of April 6 was anticipated by a seismic sequence (Figure 2.16) exhibiting hypocenters located at depths between 8 and 12 km, apparently without causing movement on specific fault planes but rather concentrating inside a crustal ramp prevalently of low angle. The main shock of April 6th (at a depth of 8.8 km) was located in the middle of this area of crustal rupture.
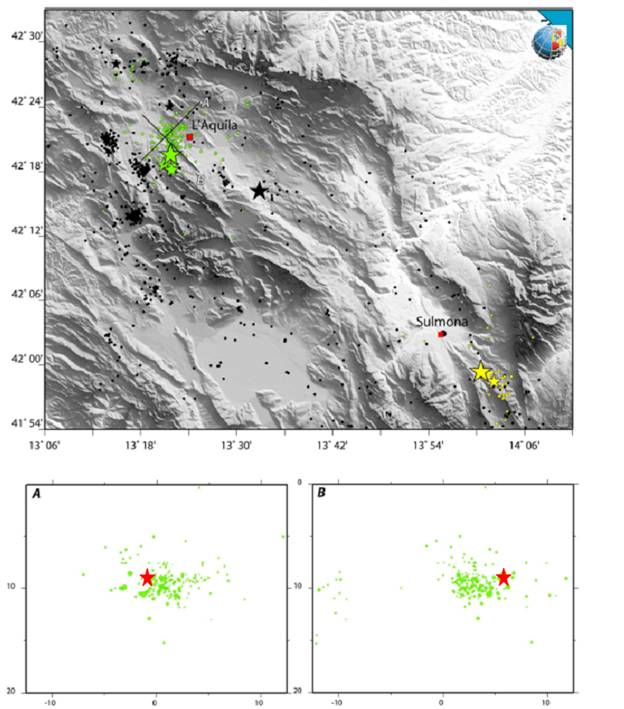
Figure 2.16. Sequence of foreshock hypocenters illustrating their position relative to the mainshock (red star). Modified image from INGV web site http://portale.ingv.it/primo-piano/archivio-primo-piano/notizie-2009/terremoto-6-aprile/cgr_31_3_2009.pdf.
c. Recent and historical seismicity and macroseismic observations
The earthquake occurred in a central Apennine area that had low seismic activity from 1980-2008 and lies between two areas with higher levels of activity. Those areas are the Umbria-Marche area to the Northwest (struck by the 1997 seismic sequence) and the Lazio-Molise area to the Southeast. Figure 2.17 shows a plan view and transverse cross-section of a portion of the chain passing through L'Aquila, with the locations of the hypocenters of earthquakes during the time period in question. The red points indicate the hypocenters of the events of the active seismic sequence, and the stars mark the three principal events of April 6, 7 and 9, 2009 (Chiarabba and De Gori, Cocco, 2009). The active sequence is therefore occurring in an area whose seismic characteristics affirm that seismic events are probable, even if they are not predictable.
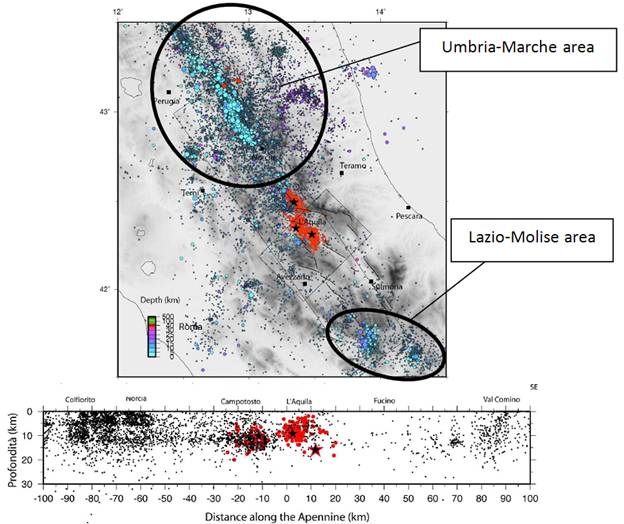
Figure 2.17. Seismicity in the central Apennines in the period 1980-2008 and location of the events of the active seismic sequence. The cross-section was drawn through the NW-SE running rectangle shown in the plan (Modified from Chiarabba and De Gori, in Cocco, 2009).
The high seismic risk of the L'Aquila area has been known for some time, thanks to historical seismic studies that have put in evidence numerous important earthquakes (Figure 2.18) that affected the central Apennines. These events are included in the parametric catalog of Italian earthquakes Catalogo Parametrico dei Terremoti Italiani, versione 4 (Gruppo di Lavoro CPTI, 2004), and for each one of them there is a record of the assumed location based on macroseismic observations and an estimate of Mw based on the dimensions of the area of maximum intensity. The most significant earthquakes in this area are those of 1315 (Mw > 6.7), 1349 (Mw > 6.5), 1461 (M w > 6.5), 1703 (M w > 6.7), and 1915 (M w > 7.0).
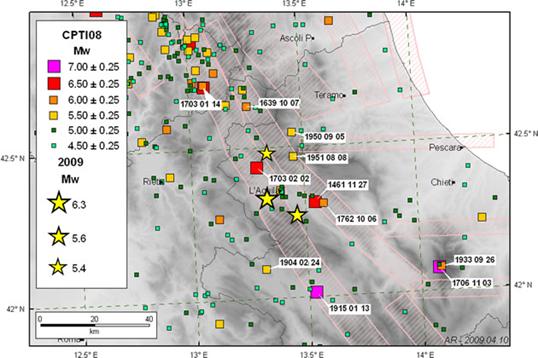
Figure 2.18. Historic seismicity of the central Apennines near L'Aquila (Rovida et al., 2009).
One of the principal events to hit the city of L'Aquila was the earthquake of 1461, which produced macroseismic effects in the same area of maximum intensity as this earthquake. The area of maximum intensity was located between the city of L'Aquila and the inhabited center of Paganica, passing through Onna (Figure 2.19, macroseismic intensity distribution from http://emidius.mi.ingv.it/DBMI04/; Stucchi et al., 2007). This event has geographic and parametric characteristics similar to those of the earthquake of April 6, 2009, since it has a maximum intensity equal to X MCS and an estimated Mw of 6.5, close to the Mw=6.3 of the April 6 event.
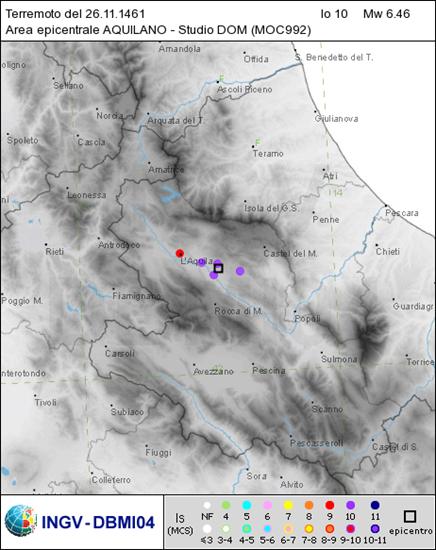
Figure 2.19. Macroseismic intensity distribution determined for 1461 earthquake (Stucchi et al., 2007).
The information contained in the historical documents make it possible to compile a seismic history for each Italian region, in the form of a graph with years on the abscissa and macroseismic intensity (MCS) on the ordinate. Figure 2.20 shows macroseismic histories of several locations affected by the April 6 earthquake. Using these graphs one can compare intensities experienced at various inhabited village centers for the same earthquake. It is notable, for example, that there is a paucity of historical information for the inhabited center of San Pio delle Camere, located near the relatively well-documented inhabited center of Castelnuovo, because the two sites experienced very different damage patterns during the recent earthquake. In fact, although the two centers are characterized by very similar construction types with "poor" stonework and masonry buildings, San Pio delle Camere (Intensity MCS=V-VI) consistently has much less damage than Castelnuovo (Intensity MCS=IX-X). The low number of intensity felts at San Pio delle Camere, compared to the many reported by the historical documents of Castelnuovo, indicate that during earthquakes San Pio delle Camere suffers less damage than Castelnuovo, because there are probably important variations in local seismic response, primarily due to the lithostratigraphic characteristics of the subsoil in the two areas (details presented in Chapter 4).
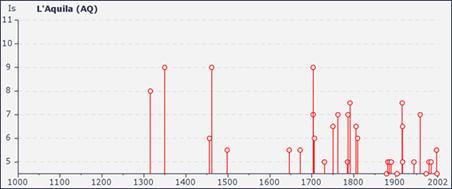
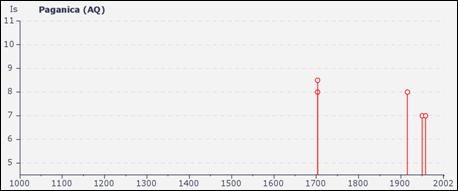
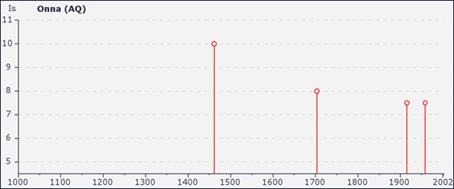
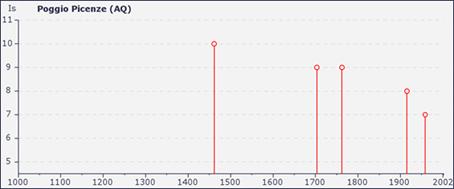
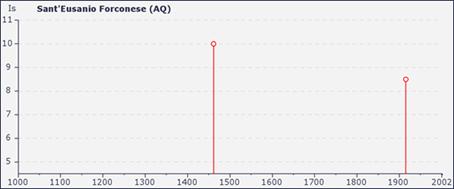
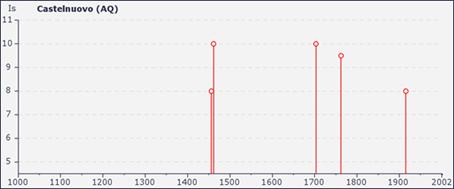
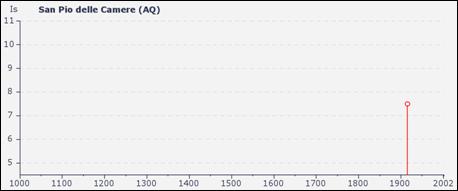
Figure 2.20. Seismic history of several inhabited centers that were affected by the earthquake of April 6, 2009 (http://emidius.mi.ingv.it/DBMI04/; Stucchi et. al., 2007).
The various macroseismic histories indicate particularly strong intensities during the earthquake of 1461 especially in Onna and Castelnuovo, which were also significantly damaged by the 2009 sequence (details in Section 4.1).
In the hours following the main shock of the current seismic sequence, the Quick Earthquake Survey Team, comprised of researchers from various agencies and institutions supported by the activities of the Department of Civil Protection, compiled a macroseismic survey of the effects of this earthquake on the built-up/inhabited areas in more than 180 localities of the L'Aquila, Pescara, Teramo and Rieti provinces. The results of the survey are presented in Figure 2.21 (QUEST, 2009: http://www.mi.ingv.it/eq/090406/quest.html).
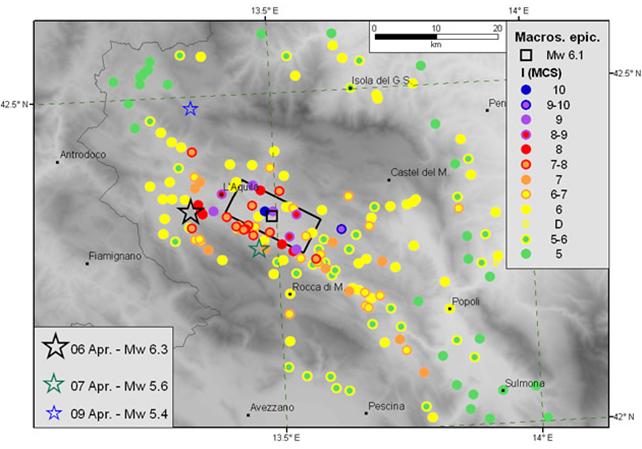
Figure 2.21. Result of the QUEST macroseismic survey (http://www.mi.ingv.it/eq/090406/quest.html) for the April 6, 2009 earthquake. The black rectangle indicates the macroseismic box, or the expression of the source fault for this earthquake, based on the distribution of macroseismic intensities.
The map shows an asymmetric distribution of damage with respect to the earthquake's epicenter. One can see that to the North and West of the epicenter (black star) the damage is limited, and the macroseismic intensities register values no higher than VI MCS. Conversely in the area Southeast of L'Aquila the intensities reach values of X MCS, with an area of intensity and damage that elongates to a significant distance from the epicenter. In the area Southeast of L'Aquila intensities of VI MCS are registered at distances much greater than those reached by the same level of intensity in the area Northwest of L'Aquila. The macroseismic intensities > VI (MCS) attributed to some villages are reported in Table 2.2. Also the value V-VI (MCS) for San Pio delle Camere is indicated.
Additional macroseismic data, not reported in Table 2.2, is still being withheld because it is in the process of being made official.
2.3 Ground Surface Displacements
The initial surface deformations associated with the April 6, 2009 Abruzzo Earthquake (Mw = 6.3) have been evaluated utilizing geodetic methods including Interferometric Synthetic Aperture Radar (InSAR) and Global Positioning System (GPS) measurements. This data provides information about the surface response, activated faults and kinematics. Field surveys were conducted to locate surface fault rupture associated with this event in areas identified by the initial InSAR data. The field observations combined with the processed geodetic data have been used to make a preliminary assessment of the probable source fault for this earthquake. Each data set is discussed individually and the data is then combined to develop a preliminary assessment of the source fault for the April 6, 2009 main shock.
a. GPS data
The INGV maintains a GPS network for monitoring crustal deformation associated with both tectonic strain and deformations associated with the numerous active volcanoes within Italy. This network is maintained within the "Rete Integrata Nazionale Gps (RING)" program operated by INGV and integrated with the Central Appennines GPS network resulting in over 100 permanent and non-permanent GPS stations distributed throughout the region (http://ring.gm.ingv.it/). Information related to the sites and instrument clusters and processing methods are available at the referenced web site. Of the stations maintained within RING, 74 are currently located in central Italy and help define the annual deformation rates relative to a stable Eurasian plate (http://ring.gm.ingv.it/velocityfield.php). Figure 2.22 shows the pre-earthquake GPS velocity field in the region surrounding L'Aquila based on data acquired between 2000 and 2008 (D'Agostino, 2009). This figure shows that the highest interseismic displacement rates are located in the central Apennines and reach magnitudes between 4 mm to 5 mm per year and generally directed in a North, North-East direction. To the Southwest of the April 6, 2009 epicenter, the displacement rates decrease to approximately 1 mm indicating extension strains across the Apennines. A counter-clockwise rotation is observed for the eastern side of the Apennines while a clockwise rotation is observed to the western side of the Apennines (with respect to a rotation pole located in Pianura Padana (http://ring.gm.ingv.it/velocityfield.php). These deformations indicate that in addition to extension, relative lateral deformations must also be accommodated across the Apennine fault systems giving rise to oblique slip on many of the structures in this region. This deformation characteristic was discussed by Galadini and Galli (2000) based on mapped fault patterns in the upper Aterno valley fault system. This is the fault system that was actived by the April 6, 2009 earthquake.
The GPS data was processed in the days following the earthquake to determine the co-seismic displacement field associated with this event. The displacements in the epicentral region between April 5 and April 9 are shown in Figure 2.23 (D'Agostino, 2009). Additional information is available in Anzidei et al. (2009). The post-earthquake GPS measurements taken on April 6, 7 and 8, 2009, when compared with the data gathered on April 5 and, for a few stations, with measurements taken the previous year, demonstrate "instantaneous" earth surface deformations associated with this earthquake (Figure 2.23, vectors in yellow). The horizontal movements indicate an area in extension with rotation of displacement vectors within the area of maximum deformation, due to the rebound effect in the NW-SE direction of the area subjected to a SW-NE traction. The vertical movements tend to increase as they move from the city of L'Aquila towards the Southeast. The preliminary best fit of the inversion of these data was obtained using movements along a fault plane running NW-SE with normal displacement in a SW direction, which generates an earthquake of Mw=6.3 with maximum co-seismic slip of 1.1 m. The location of the fault plain is constrained near Paganica, where co-seismic fractures of the ground are thought to have occurred (EMERGEO Working Group, 2009).
Figure 2.22. Annual deformation rates in central Italy determined from GPS data acquired from the RING GPS Network (Modified from D'Agostino, 2009).
Figure 2.23. GPS data inversion: on the left horizontal predicted (red) and observed (yellow) displacements, on the right vertical movements and proposed fault plane solution (Modified from D'Agostino, 2009).
b. InSAR data
Synthetic aperture radar images were acquired by two different satellite systems in the days following the April 6 main shock. The post-seismic acquisitions were combined with compatible images taken previously during routine operations to develop interferometric images.
The first satellite system to acquire a post seismic image was from the COSMO-SkyMED constellation. This constellation is currently composed of 3 satellites (a fourth satellite will be operational in the next months) developed and maintained by the Italian Space Agency (Agenzia Spaziale Italiana) in cooperation with the Italian Ministry of Defense. One of the primary goals of COSMO-SkyMED is to provide data for scientific purposes for the prevention and management of environmental disaster and associated relief efforts (earthquakes, volcanoes, floods, etc.). The satellite constellation allows SAR images to be acquired at a specific location with a minimum time difference of 1 day, more typical short term acquisition is 2-3 days between images. This data can be used to assess the temporal surface strains related to this earthquake. More detailed information related to the Sky-Med constellation and the satellite components can be found at http://www.cosmo-skymed.it/en/index.htm.
The second satellite to acquire SAR images after the earthquake was the ENVISAT - Earth Observation Satellite operated by the European Space Agency (ESA). This satellite utilizes an Advanced Synthetic Aperture Radar (ASAR) system to increase the options available for image acquisition based on the need(s) of different scientific communities. More detailed information about the ENVISAT Earth Observation Satellite can be found at ESA's web site ( http://www.esa.int/esaEO/SEMWYN2VQUD_index_0_m.html ).
The interferometric analysis is insightful regarding the co-seismic effects of this earthquake. Our primary discussion is based on the work of Salvi et al. (2009), who present the data and detailed analyses.
The first interferometric analysis available to the scientific community was developed from the COSMO-SkyMed constellation using images from the February 19 and April 9. This image was processed by INGV researchers and the ISA and utilized for assisting in the initial field reconnaissance. Figure 2.24 shows the first interferogram, the epicenter for the Mw = 6.3 main shock (large square) and events with a Mw > 4.0 (small squares) and the location of ground failures (yellow line). This image shows that the initial surface deformations were concentrated to the north of the main event epicenter and along a line running from L'Aquila past Poggio Picenze. The surface deformation (fringes) are well constrained within different lineaments developed in the surrounding region some of these lineaments correspond to identified faults while others do not. Changes in the primary orientation of the fringes can also be observed to change across different lineaments.
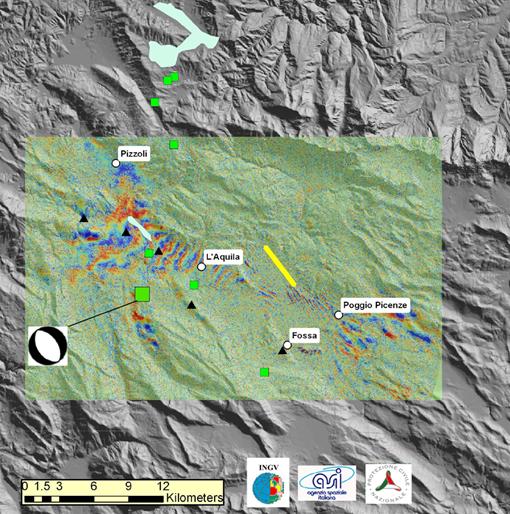
Figure 2.24. Interferogram developed from Cosmo-SkyMed images taken on 19 February and 9 April. The Mw= 6.3 main event is identified by the large square and focal mechanism. The Mw > 5.0 events are marked by the small squares. The yellow line indicates the area of observed ground failures (Emergeo Working Group, 2009).
Figure 2.25 presents one of these analyses showing the interferometric fringes that were created using images downloaded from ENVISAT and COSMO-SkyMed. Images of the area affected by the earthquake, which were gathered beginning on April 6 by COSMO-SkyMED, were analyzed with the interferometric technique DInSAR (Differential Interferometry Synthetic Aperture Radar). This technique involves taking images from the same geographic area, using the same view angles at different times, for measuring with specific algorithms, the deformations produced on the ground surfaces (http://www.asi.it/it/news/la_faglia_del_terremoto_individuata_grazie_ai_dati_di_cosmoskymed). In Figure 2.25 each concentric fringe quantifies 1.5 cm of co-seismic vertical deformation. In the same figure, Salvi et al. (2009) also show the trace of the alignment of ground fractures that were observed near the inhabited center of Paganica (EMERGEO Team, 2009). Looking at the figure the following observations can be made:
- The maximum negative vertical deformation is about 25 cm (lowering of the topographic surface corresponding to the area of the fault's hanging wall); the maximum positive vertical deformation is about 8 cm (uplift of the topographic surface corresponding to the area of the fault's footwall);
- The area of maximum negative vertical deformation does not coincide with the outcrop area of the Paganica fault (see black line segment in Figure 2.25), which has been hypothesized as having generated this earthquake. Rather, the zone of maximum deformation is located about 3-4 km Southwest of this tectonic element, a hypothesis supported by the band of fractures observed on the ground (Emergeo Working Group, 2009). The maximum vertical displacements of the observed fractures are on the order of 10-12 cm;
- The area of maximum negative vertical deformation coincides with a level zone situated to the Southeast of L'Aquila and Southwest of Bazzano; this zone is next to the plain on which the village of Onna is situated. The plain interrupts the East relief alignment, where the Bazzano Fault is located. The Bazzano fault is reported to have showed superficial evidence of co-seismic reactivation (Emergeo Working Group, 2009);
- The interferometric fringes do not abruptly close on the plain of the Paganica Fault, but display two trends at different gradients, one to the Northeast and the other to the Southwest of the area of maximum vertical deformation. The first group of fringes presents a higher gradient than the second.
- The interferometric fringes show variations in trend at various points and along several lines associated with active tectonic elements (Pettino Fault, just to the Northwest of L'Aquila and Bazzano-Fossa Fault, between L'Aquila and Paganica) that also had a co-seismic displacement of modest extent. In particular, Figure 2.25 shows a discontinuity in the interferometric fringes (indicated by the red line) that would correspond to the antithetic Bazzano-Fossa Fault.
- The preliminary inversion models of co-seismic movement (Figure 2.26) show that the Paganica Fault would have a limited slip on the surface. This fact is supported by field observations at several places along the alignment of co-seismic ground fractures, which noted maximum displacements no greater than 10-12 cm, compared to a maximum slip of about 1 m on the fault.
These observations lead to several preliminary conjectures:
- As was hypothesized by several researchers (Valensise, 2009) the fault responsible for the earthquake would have dislocated a portion of the crust without rupturing the surface, since the interferometric fringes do not abruptly close on the alignment of ground fractures, marking the transition between the hanging wall and the footwall;
- The shaking would have resulted in the reactivation of these surface faults, namely the Bazzano-Fossa, Pettino and above all the Paganica Fault (Valensise, 2009). This last would have a dip of about 70deg, in accordance with the dip of other active faults in the area. The Paganica Fault would be rooted in a deeper fault with a lower angle (dip of about 50deg). This fault would have produced the main shock, and the focal mechanism does in fact suggest a low angle source. An incidental concentration of seismic energy would have occurred on the Paganica Fault, and the strong shaking would have caused a displacement greater than that experienced by the two other tectonic elements that were reactivated (Bazzano-Fossa and Pettino Faults);
- The difference between the extent of negative and positive vertical displacement would indicate the activation of a mechanism of gravitational sinking, specifically of a movement along a normal fault that does not manifest footwall uplift;
- The movement of reactivation (or of activation, in the case of the Paganica Fault, if it were responsible for the main shock) confirms that these are active and capable faults.
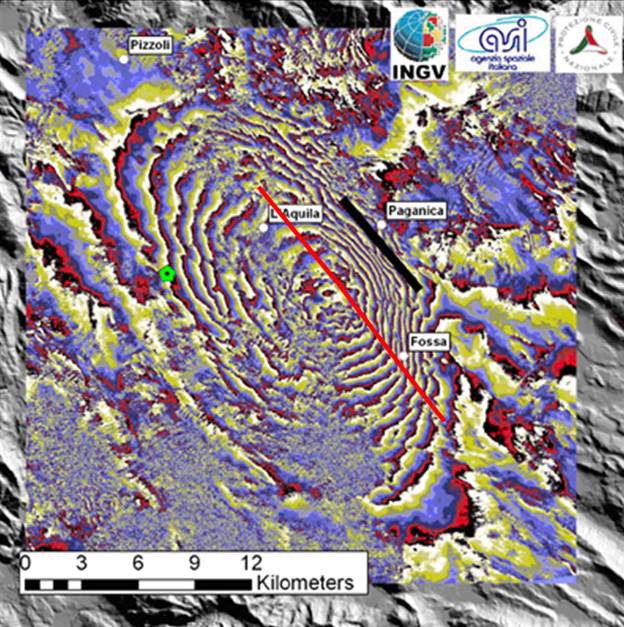
Figure 2.25. Interferometric fringes of co-seismic displacements (modified from Salvi et al., 2009). The black line indicates the alignment of ground failures associated to the Paganica Fault. The discontinuity marked by the red line corresponds to the antithetic Bazzano-Fossa Fault.
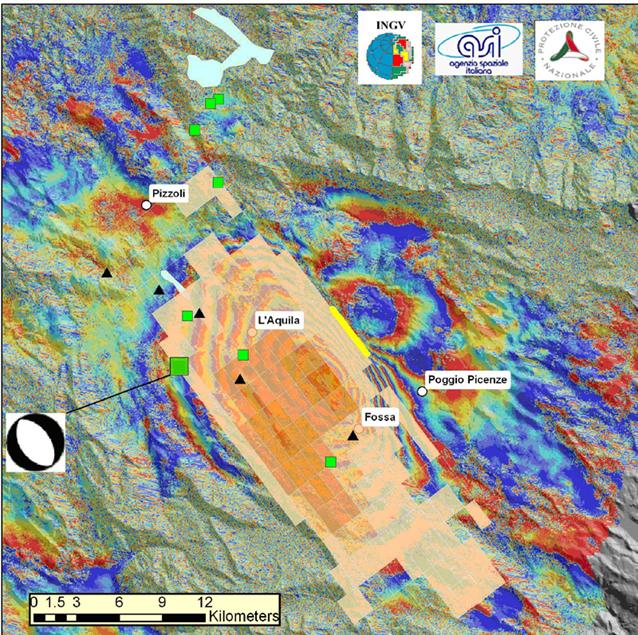
Figure 2.26. Fault plane solution by InSAR data inversion (Salvi et al., 2009). The yellow line indicates the alignment of ground failures associated to the Paganica Fault. The maximum slip modeling corresponds to the surface area with maximum vertical displacement. Near the surface, along the Paganica Fault, the vertical displacement is very small.
c. Surface Rupture observations
Several observations of ground cracking have been made in areas near where the fault might be expected to reach the surface.
In the hours immediately following the earthquake, the researchers of the Emergeo Working Group began their reconnaissance of possible co-seismic effects, in collaboration with colleagues from other agencies and institutions. The scope of their activity was to plan numerous investigations spread out over an area of about 900 km2. After that survey came the release of several general observations, which are contained in a report (translated from Emergeo Working Group, 2009):
"A preliminary analysis of all the observed co-seismic effects definitely draws attention to the peculiarities of the ruptures observed along the Paganica Fault. In fact, these ruptures, despite being limited in terms of aperture and down-throw, demonstrate a continuity that has no equal in those examined along the other structures where the ruptures, scarps or remobilizations appear sporadically and in correspondence with favorable morphological conditions. Furthermore it was observed that ruptures along the Paganica Fault intersect whether in developed and paved areas or more or less open space, and this occurs independent of the local morphological situation, in some cases forming an angle with the slope. The internal makeup of the structures and microstructures and the total length of approximately 5 km (...), along with other evidence just discussed, lead to ruling out a gravitative origin for these ruptures and to interpreting the set of ruptures along the Paganica Fault as the surface expression of the deeper fault that produced the event of April 6, 2009. It is interesting to note that the location of this set of ruptures is in complete accordance with the seismological, geodetic and remote sensing observations gathered so far. Although limited to a stretch of several hundred meters, even the ruptures along the Bazzano (...) and Monticchio-Fossa (...) faults can represent the surface expression of an antithetic structure reactivated during the event."
Many observations contained in the Emergeo report are also confirmed by observations of the GEER Team, which surveyed ground ruptures in areas near the inhabited center of Paganica. In this zone the fracturing lines up for several kilometers and cuts the existing morphology with a sort of continuity. The area situated to the southwest of the alignment of fracturing sits lower with respect to the sector located northeast of the alignment, although to a very modest degree (a few cm). The ground fractures tend to have an average bearing of 140deg.
Near the inhabited center of Paganica rupture of a water supply line was observed, which some have interpreted as a co-seismic surface expression of the fault (Figure 2.27). Additional ground fissures were identified at the center of Paganica village as depicted in Figures 2.28. They are concentrated close to a two storey R/C structure built on a slope. Breakage of water piping system (repaired at the time of GEER reconnaissance) was observed (Figure 2.28). Movements are generally in the direction of gravity.
Additional observations by Ken McCaffrey, Max Wilkinson (University of Durham), Richard Phillips (University of Edinburgh), Gerald Roberts (University of London), and Alessandro Michetti (University of Insubria (personal communication with G. Roberts, 2009) in the Paganica area are strongly suggestive of surface rupture (see also Walters et al., 2009). Figure 2.34 shows the results of a lidar scan that indicates clear normal slip. The feature shown in the image has a strike and position that aligns with the Paganica fault. The length of the feature is approximately 3-4 km, and the amount of slip is approximately 10 cm.
Based on the consistent observations from numerous groups, surface fault rupture appears to have occurred on the Paganica fault. The slip was consistent with normal faulting and has the length and displacement characteristics described by Emergeo Working Group and the Durham, London, Edinburgh, Insubria Group.
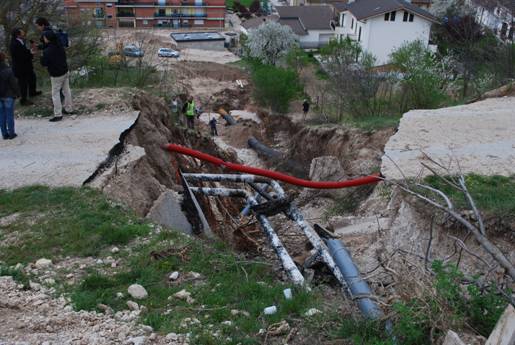
Figure 2.27. Paganica village: broken major water pipe (repaired) due to co-seismic rupture (Lat. 42,36537N Long. 13,46803E). Photo by Mylonakis G.
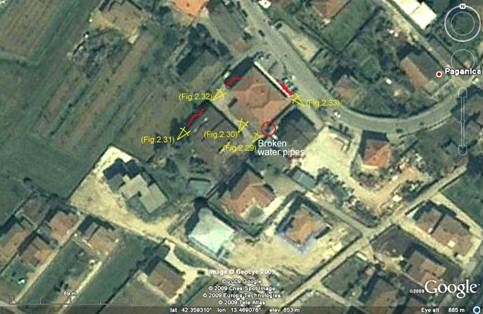
Figure 2.28 Plan view of Paganica site with marked positions of ground fissures, paved walkway cracks and broken water pipes. Directions of photo shots are indicated by yellow signs.
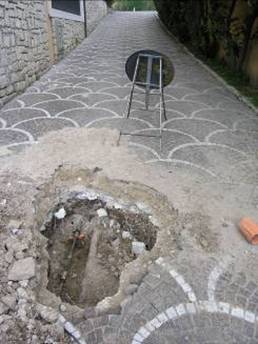
Figure 2.29. Failure of water pipe. (42.359335N, 13.468954E).
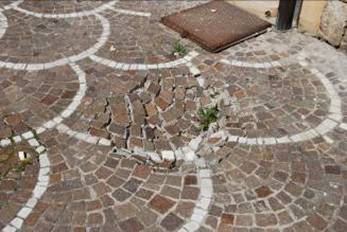
Figure 2.30. Local settlement close to piping system (42.359335N, 13.468954E).
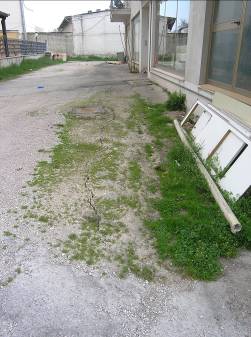
Figure 2.31. Ground fissures at the side of the building (42.359817N, 13.468649E).
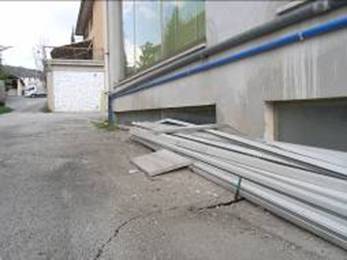
Figure 2.32. Ground fissures and settlement at the side of the building (42.359817N, 13.468649E).
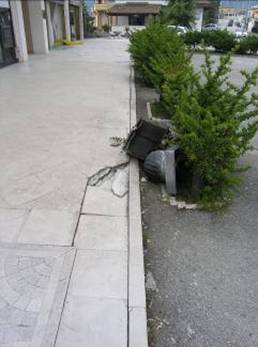
Figure 2.33. Separation cracks at sidewalk on front of building (42.359335N, 13.468954E).
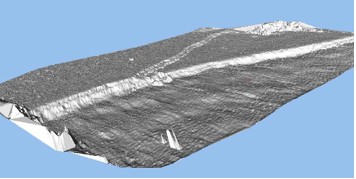
Figure 2.34. Lidar scan of normal faulting along Paganica fault (courtesy of G. Roberts, personal communication, 2009).
2.4 Preliminary source fault proposed for the April 6th, 2009 Earthquake
Using nonlinear inversion of the accelerometer and GPS data in order to model the rupture process that occurred on the presumed rupture surface that generated the April 6 earthquake, Figure 2.35 shows the projection of the proposed fault surface, whose characteristics are reported in Table 2.3 (Piatanesi and Cirella, 2009).
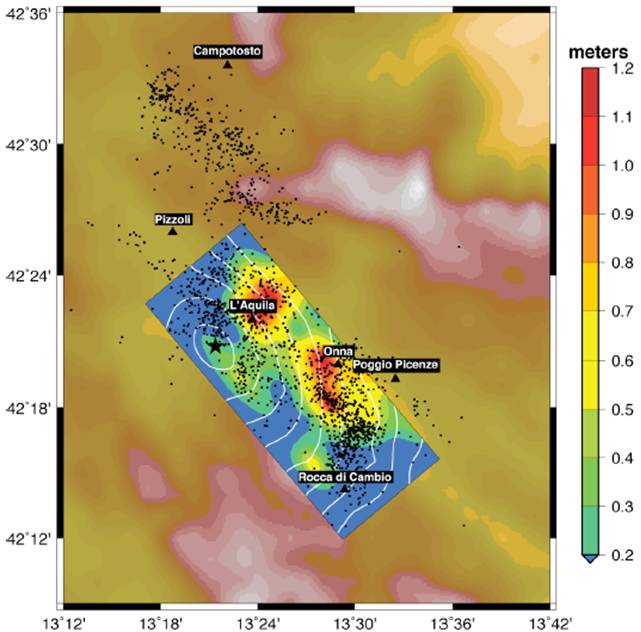
Figure 2.35. Inverted rupture model projected on the Earth surface. Colors on the fault plane indicate the slip distribution. White contours represent the position of the propagating rupture at 1 s interval. Black dots are the recorded aftershocks (from Piatanesi and Cirella, 2009).
Table 2.3. Parameters of the source responsible for the April 6, 2009 earthquake (from Piatanesi and Cirella, 2009 and from the focal mechanism: http://earthquake.rm.ingv.it/qrcmt.php).
Coordinates of the corners of the rectangular fault plane |
A |
Lat. (N): 42 22,71' |
Lon. (E): 13 17,14' |
B |
Lat. (N): 42 26,36' |
Lon. (E): 13 23.00' |
C |
Lat. (N): 42 15,64' |
Lon. (E): 13 35,14' |
D |
Lat. (N): 42 11,90' |
Lon. (E): 13 29,14' |
Length |
26 km |
Width |
11 km |
Strike |
140 deg |
Dip |
43 deg |
After this preliminary elaboration (originally available two weeks following the April 6 earthquake), additional fault plane solutions have been inverted using different data. Two such inversion results are reported in Figures 2.36 and 2.37, respectively by Chiarabba et al. (2009) and Atzori et al. (2009a, b). These solutions have strikes smaller than one given in Table 2.3. The different source planes have an area approximately between 250 and 280 km2.
Figure 2.36. Proposed source plane (black box) for the April 6 earthquake by inversion using seismological data of about 700 events of 6000 recorded by INGV National Seismic Network. The strike is about 130 deg. Reproduced from Chiarabba et al. (2009).
Figure 2.37. Distribution of the slip movements on the source area for the April 6 earthquake by linear inversion of SAR and GPS displacements up to the April 12. Table shows source plane dimensions. Figure from Atzori et al. (2009a, b).
e. Elements for a scientific discussion
At present the various observations and analyses of the data lead to two primary hypotheses about the tectonic structure that generated the April 6 earthquake. These two hypotheses are probably only apparently in disagreement with each other. One initial theory is that the Paganica Fault was seismogenic and capable, in other words that it could have generated the April 6 event and displaced far enough to reach the surface (Figure 2.38) (Salvi et al., 2009). This hypothesis is plausible, although it would not be entirely convincing if one considers the low surface displacement evidenced by the observed fracturing (max 10-12 cm, but only in a few places) and the area of maximum negative vertical deformation, which on the surface is located about 3-4 km from the surface expression of the Paganica Fault.
The second hypothesis involves the activation of a low angle fault, which displaced at depths from about 12 km to about 2-3 km, and whose projection towards the surface is represented by the Paganica Fault. The movement observed along this fault would have been cause by passive remobilization (Valensise, 2009), like that of the Bazzano-Fossa Fault, which is antithetic with respect to the Paganica Fault and intersects its plane at a depth of about 2-3 km.
In addition to the two hypotheses currently in discussion, there are other considerations and theories derived from literature and the great mass of data provided by the INGV and GEER teams.
The Paganica Fault (which dips to the Southwest) and the Bazzano-Fossa Fault (which is antithetic to the Paganica Fault, dipping towards the Northeast) have produced the graben where Onna is situated (Figure 2.39). This area, which suffered strong damage with maximum macroseismic intensity X MCS within Onna, likely experienced an incidental concentration and entrapment of seismic energy inside the graben filled with Quaternary sediments, which are in strong velocity contrast with the rigid substrate composed of Meso-Cenozoic deposits (limestones and marls).
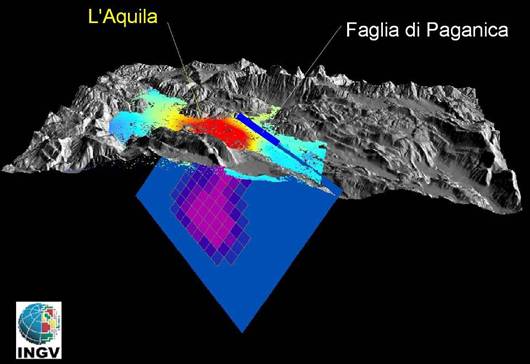
Figure 2.38. Fault plane solution by InSAR data inversion, corresponding to the theory of a seismogenic and capable Paganica fault (Salvi et al., 2009). The results of displacement modeling are shown on the fault plane.
To the West of the graben where Onna is located there is a morphological flat area, depressed with respect to the surrounding zones, that corresponds to the area of maximum negative vertical deformation derived from the SAR data. Therefore, this area seems to represent the morphological expression of deeper tectonic movements, compared to those that were produced on the surface faults of Paganica and Bazzano-Fossi. The actual morphology of this depressed area suggests that such vertical movements would have previously involved this plain, seemingly without surface expressions of tectonic discontinuities. Another possible explanation arises for the Onna graben, which is the result of coupled movement between the Paganica Fault and the Bazzano Fault. The mobilization of the Paganica Fault would therefore not have been seismogenically significant, in that this tectonic feature would have been involved only in processes of selective remobilization (Valensise, 2009). The Paganica Fault would be rooted at such depth that would render possible and probable a process of channeling incident seismic energy produced on another, deeper fault plane that would not have a surface expression (blind fault) (Valensise, 2009), with a low dip angle like the one suggested by the focal mechanism (http://earthquake.rm.ingv.it/qrcmt.php) of the April 6 earthquake (could it be due to an "old" compressive thrust reactivated in the normal direction?).
Certainly a more thorough and accurate analysis of the data and, above all, a contextualization of the various issues within the existing framework of the central Apennines will contribute to the likely clarification of several controversial points that will be debated in the future.
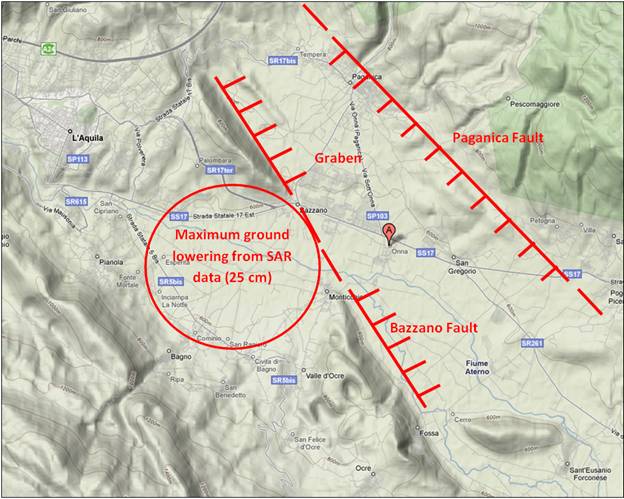
Figure 2.39. Relationship between Paganica and Bazzano active faults and topography.
|