3.0 Ground Motion
3.1 Attributes of recording stations
The L'Aquila main event of April 6, 2009 was recorded by 56 digital strong motion instruments, 14 of which are in the Abruzzo region as shown in Figure 3.1a. Figure 3.1b shows the locations of four instruments located on the hanging wall of the fault near L'Aquila, three NW of the city in an array with one reference rock station (AQG) and two stations on recent alluvium (AQA, AQV) and one instrument near the city center on Pleistocene material (AQK). An additional instrument known as the Moro station recorded the mainshock (AQM), although this data has not been released. The other 42 instruments that recorded the mainshock are generally located in portions of the Apennines NW and SE of the source region, as shown in Figure 3.2. These instruments are part of the Italian Accelerometric Network (RAN - Rete Accelerometrica Italliana) that is owned and maintained by Italian Department of Civil Protection (DPC). The entire network is comprised of 388 accelerometers, 199 analogue and 269 digital, distributed across Italy. All stations listed in Table 3.1 have digital accelerometers, principally Altus Etna and K2 devices with 24-bit A/D converters. It is possible that additional analogue instruments recorded the earthquake and that data from those instruments will become available at a later date.
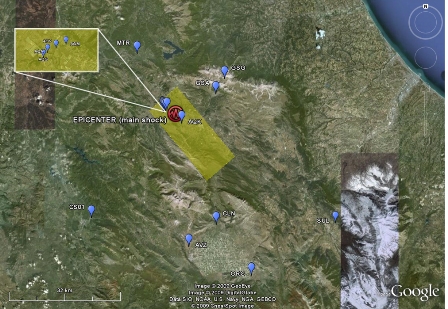
Figure 3.1a. Locations of accelerometers in Abruzzo region that recorded the 6 April 2009 main shock. Fault plane surface developed in Section 2.3 shown in yellow.
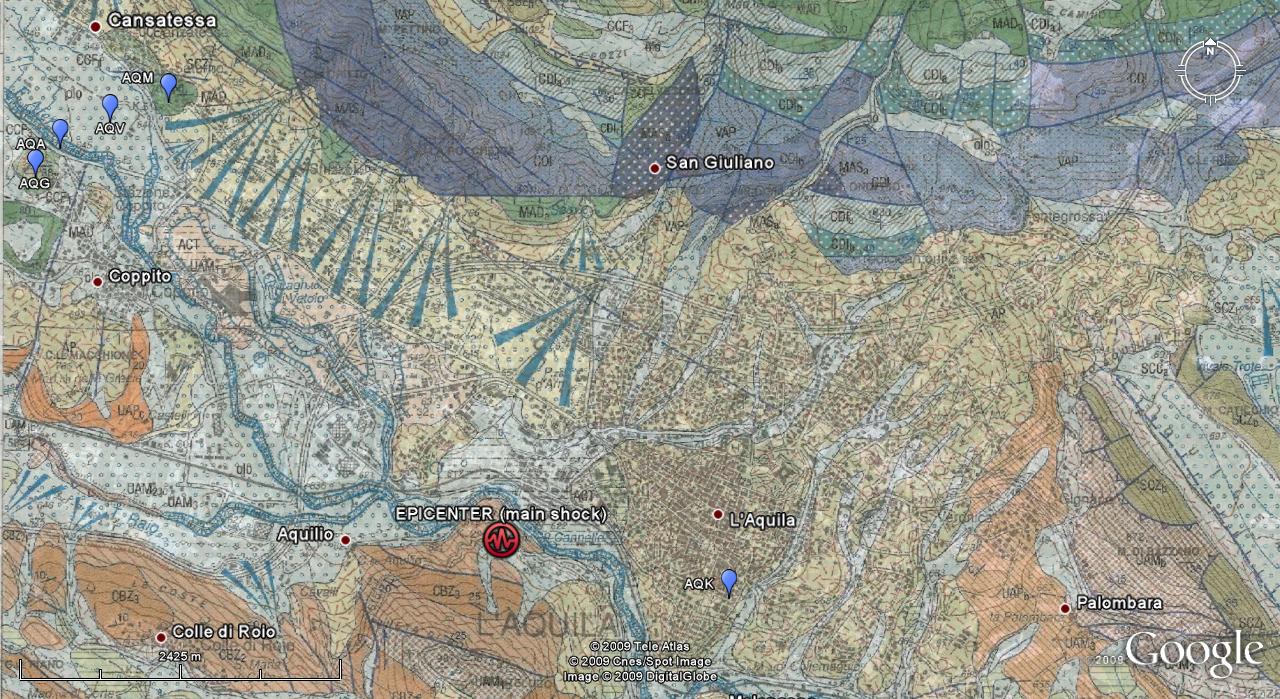
Figure 3.1b. Location of instruments on hanging wall near L'Aquila overlayed on 1:50000 scale geology map.
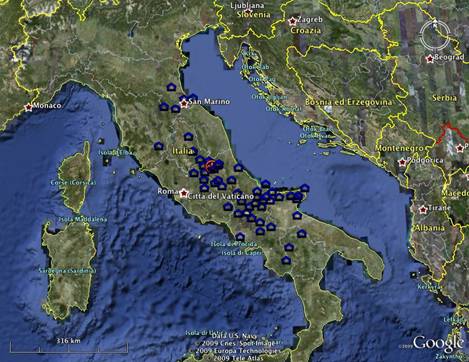
Figure 3.2. Locations of instruments that recorded 6 April 2009 main shock.
Table 3.1 lists attributes of the 56 digital accelerometer stations that recorded the mainshock, including location, surface geology, Vs30 (average shear wave velocity in upper 30 m), and instrument housing type. Surface geologic descriptions are preliminary in many cases, being based on relatively large-scale maps (1:100.000) by Servizio Geologico d'italia. We generally prefer to classify surface geology using relatively local smaller-scale maps, which will take additional time to locate for most of the stations. However, some sites have been previously classified by Scasserra et al. (2009a) using 1:25000 and 1:5000 scale maps, and those results are shown in Table 3.1 where available. Furthermore, relatively local 1:25000 maps have been retrieved for the near-source region (unpublished INGV and DPC internal files), and classifications for instruments in those areas are derived using the local maps.
A site parameter commonly used in many modern ground motion prediction equations is Vs30. We evaluate Vs30 values following the protocols of Scasserra et al. (2009a), which can be summarized as:
- Data Source Type A: On-site measurements of velocity using established geophysical techniques (downhole, cross-hole, SASW, etc.). As shown in Table 3.1, there are three such mainshock stations for the L'Aquila earthquake (BOJ, AQV, STN).
- Type B: Velocity measurements are available at nearby sites having the same surface geology as the subject station, as confirmed by on-site observations by a geologist. Three such stations are listed in Table 3.1 (AVZ, AQA, SSR).
- Type C: Velocity estimated based on measurements from the same geologic unit as that present at the site (based on local geologic map, but no site visit by a geologist).
- Type D: Velocity estimated based on general (non-local) correlation relationships between mean shear wave velocity and surface geology.
For Type C and D sites, Scasserra et al. (2009a) developed relationships between surface geology and Vs30 for a number of surface geologic categories relevant to the subject region: Quaternary alluvium categories segregated by sediment depth and material texture (Qal,thin; Qal,deep; Qal,coarse), older Quaternary alluvium (Qoa), Quaternary to Tertiary alluvial deposits (QT), Tertiary sandstone formations (Tss), Pleistocene to Pliocene conglomerate (Pc), and Mesozoic limestone and volcanic rocks (Ml and Mv, respectively).
Table 3.1 lists for each of the 56 digital stations that recorded the earthquake the Data Source Type (A-D), the local geology as inferred from the smallest scale map currently available, the closest-related geologic category of Scasserra et al. (2009a), and the corresponding Vs30 value (as measured or estimated, depending on the data source type). Based on those Vs30 values, Eurocode 8 (EC8) classifications are also listed.
3.2 Attributes and preliminary processing of recordings
Uncorrected digital accelerograms were downloaded from the Department of Civil Protection website (www.protezionecivile.it) approximately one week after the earthquake. Those motions were forwarded to the USGS National Engineering Strong Motion Project Data Center (Chris Stephens) and Pacific Engineering and Analysis (Walt Silva) for processing. Preliminary processing in which consistent high-pass and low-pass corner frequencies are applied to all records has been completed by the USGS group (Stephens, personal communication, 2009) and was also performed separately by Working Group ITACA (2009). Pacific Engineering and Analysis processed the data following PEER/NGA protocols, which include selection of record-specific corner frequencies to optimize the usable range of the recordings. Note that this processing reduced the number of recordings from 56 to 47 due to the noisy nature of recordings more than 200 km from the source. Specialized baseline correction has not yet been performed of near-fault stations (the AQ* stations) to draw out downward baseline-shift, which is evident in those recordings.
The ground motion intensity measures of Peak Horizontal Acceleration (PHA) and Peak Horizontal Velocity (PHV) for the three components are shown in Table 3.2. Note that according to RAN standard installation procedures (Milana, personal communication, 2009), horizontal azimuths for all of the digital instruments are 000 for the 'north' component and 090 for the 'east' component. Positive vertical is upward. Also shown in Table 3.2 are closest distances to the fault plane (Rrup) and closest distances to the surface projection of the fault plane (Rjb). The fault plane that is the basis for these distances is modified from that in Section 2.4 by removing edge areas that were subject to low slip.
3.3 Preliminary comparisons to GMPEs
Figure 3.3 shows geometric mean PHA and PHV, as computed using the GMRotl50 parameters (Boore et al., 2006), as a function of Rjb for EC8 subsoil classes A (rock), B (weathered rock and stiff soil), and C (medium-stiff soils). Four stations (AQA, AQK, AQG, AQV) are on the hanging wall and hence have Rjb=0. Those are plotted at Rjb=1 km in the figure. Also show in Figure 3.3 are medians and medians +/- one standard deviation (sigma) for the Boore and Atkinson (BA) 2008 GMPE as modified for faster attenuation in Italy by Scasserra et al. (2009b) for PHA (no modification for PHV). The BA GMPE was plotted for Vs30=360 m/s. The red curve in the figure is the original BA 2008 median. Note that the modification for faster distance attenuation better captures the data trends.
Data for EC8 categories A and B are numerous and allow approximate inference of site effects. At large distance (Rjb > ~50 km) B sites appear to be higher-amplitude than A sites, whereas the difference is not distinguishable for the relatively few stations at closer distance (Rjb < ~30 km). These apparent trends will be evaluated through statistical analysis in subsequent work.

Figure 3.3. Variation of orientation-independent geometric mean (GMRotl50) PHA and geometric mean PHV with Rjb for EC8 site categories A, B, and C
Actual site conditions at the recording stations vary as shown in Table 3.1. To more accurately evaluate the performance of the GMPEs relative to the data, we calculate residuals for each data point considering the appropriate source distance and site condition as follows:
where (IMi)rec = value of ground motion intensity measure from recording i and (IMi)GMPE = median value of that same IM from a ground motion prediction equation. The intensity measures used here are PHA and Sa at 0.2, 0.5, 1.0, and 2.0 sec. We used the BA GMPE as modified by Scasserra et al. (2009b) for T = 1.0 sec, the Sabetta and Pugliese (1996) GMPE, and the Ambrasseys et al. (2005) GMPE. Results of those calculations are shown in Figure 3.4 for the IMs of PGA and 1.0 sec Sa.
The results shown in Figure 3.4 indicate that the distance attenuation for the modified BA relation is consistent with the data, as indicated by the nearly horizontal trend lines. The other GMPEs have what appears to be a significantly non-horizontal trend line for PHA, suggesting that the actual distance attenuation is faster than that predicted by the models. These trends will be more formally evaluated in subsequent work.
Although nearly horizontal, the BA trend line is not at zero ordinate. This indicates a systematic bias of the model relative to the data. Since this event is well recorded, this bias is nearly equal to an event term as would be calculated from a mixed-effects regression (e.g., Abrahamson and Youngs, 1992). Non-zero event terms are typical; what is of interest is to see if the event terms for the L'Aquila mainshock are consistent with event-to-event scatter as observed from previous earthquakes. This is typically represented by event term dispersion t. Figure 3.5 shows the L'Aquila mainshock event terms at the aforementioned periods along with the +/- t model from the BA GMPE (which was not modified by Scasserra et al., 2009b). The L'Aquila event terms are seen to be unusually low at short periods but nearly zero at longer periods.
In Figure 3.6 we show V/H ratios for the mainshock peak accelerations and velocities, where H is taken as the geometric mean of the recorded motions. For peak acceleration, V/H is high in the near field and drops with distance in a manner consistent with empirical relationships (Bozorgnia and Campbell, 2004). For peak velocity, the V/H increases with distance.
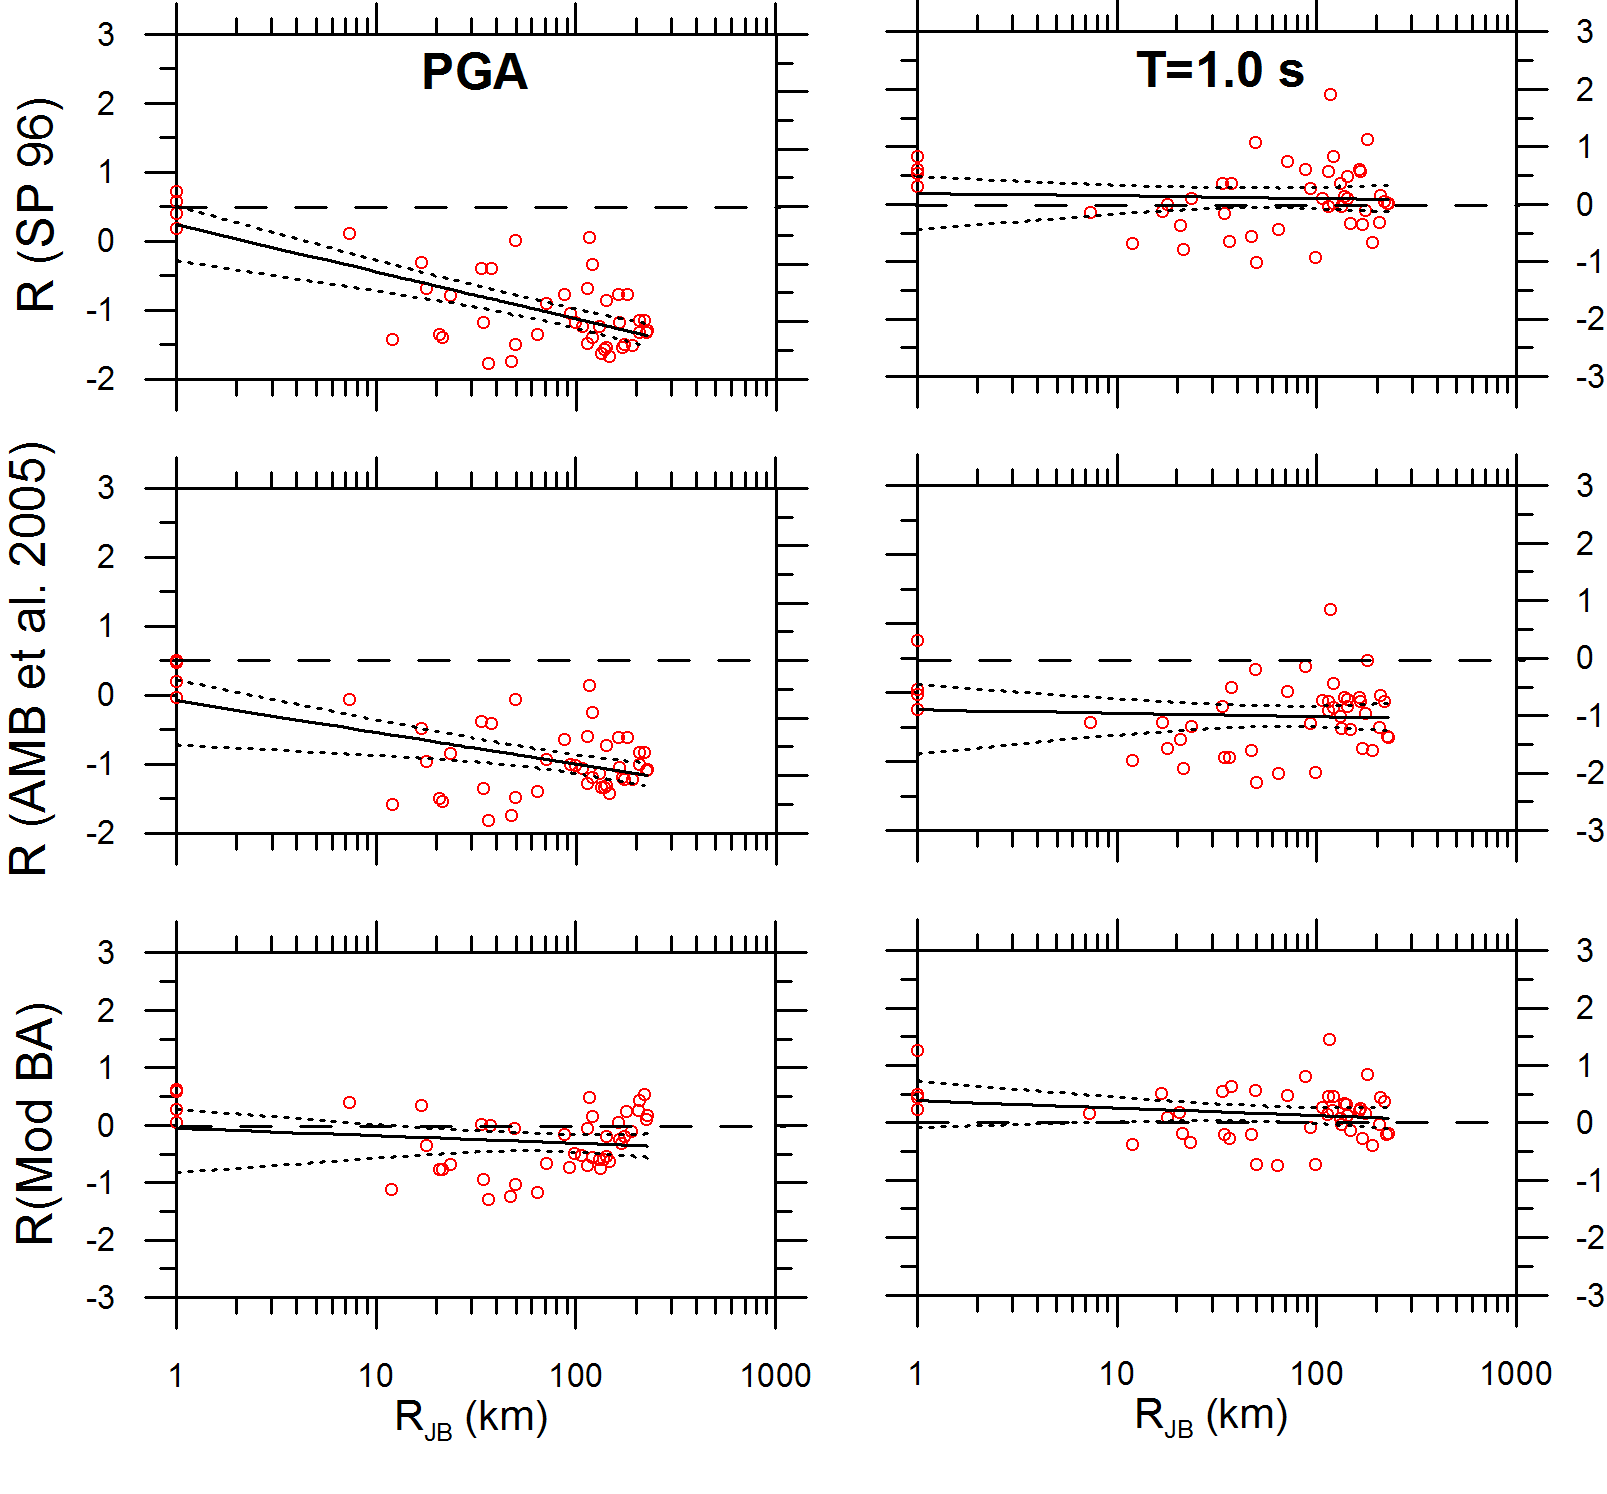
Figure 3.4. Residuals of intensity measures from recorded ground motions (GMRotl50) relative to predictions of the modified Sabetta and Pugliese (SP) (1996) GMPE, the Ambrasseys et al. (AMB) (2005) GMPE, and the modified BA GMPE (Scasserra et al., 2009b). Log-linear trend line shown with 95% confidence limits.
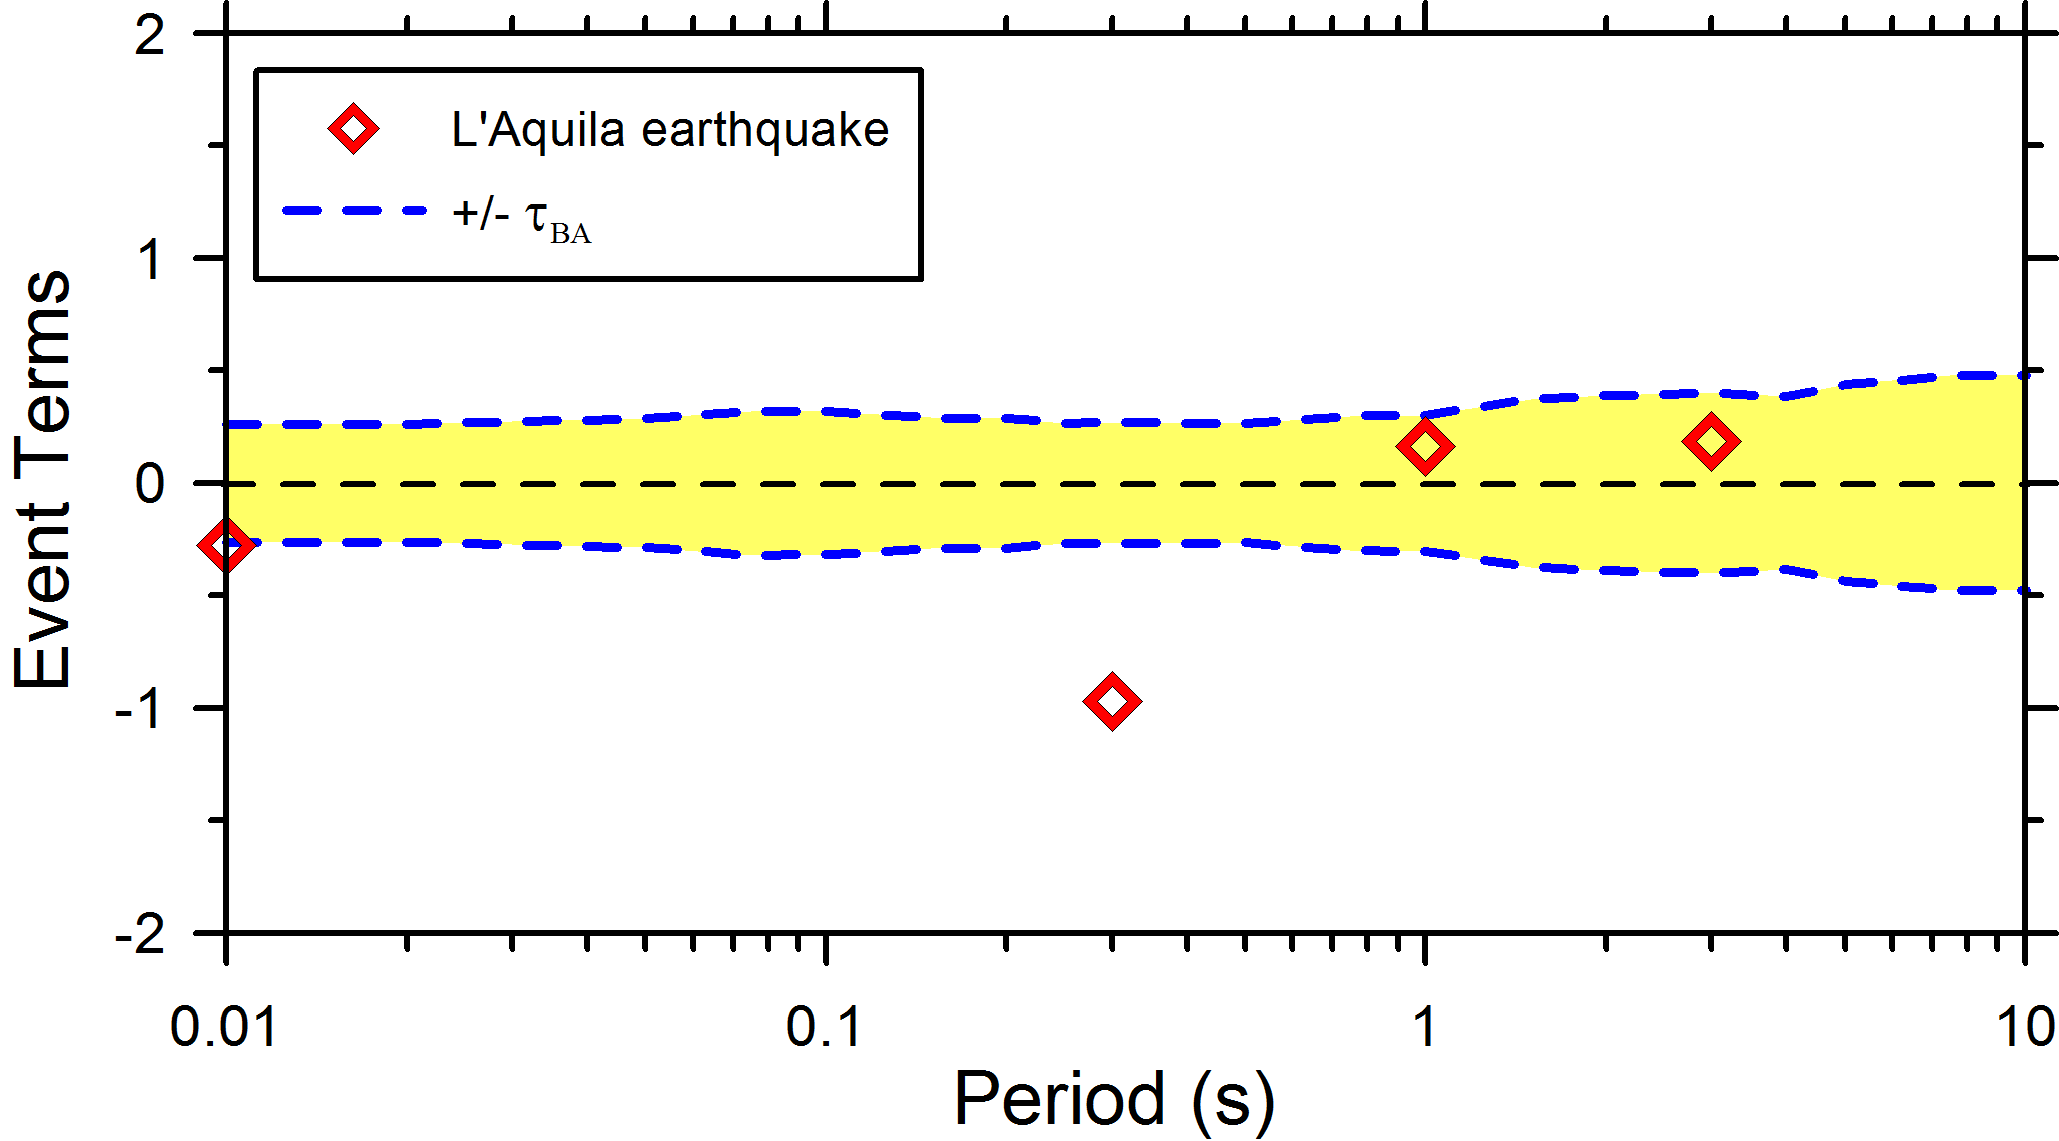
Figure 3.5. L'Aquila earthquake event terms versus standard deviation of event terms (t) from the BA (2008) GMPE.
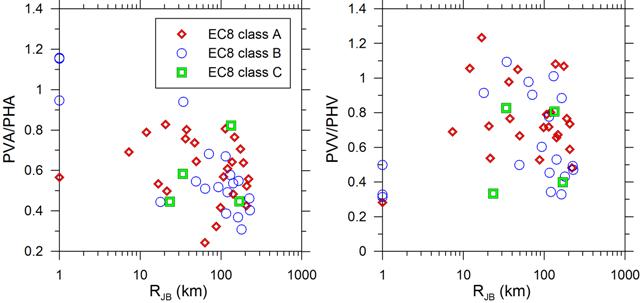
Figure 3.6. L'Aquila earthquake V/H ratios for peak acceleration and velocity.
3.4 Spectra of near-fault recordings
Figure 3.7 shows 5% damped pseudo-acceleration response spectra for four stations on the hanging wall of the fault. Before calculating spectra, the motions were rotated into fault normal and fault parallel directions, based on the 147 degree strike reported in Section 2.2. The results are not suggestive of significant polarization of ground motion in the fault normal direction, which is an indicator of rupture directivity.
A notable feature of these motions is significant energy content at high frequencies for which motions in California have often saturated to the peak acceleration. In the 0.3-1.0 sec period range, the two motions from relative soft site conditions (AQA and AQV) appear to be relatively more energetic than those for firmer site conditions (AQG and AQK).

Figure 3.7. Pseudo acceleration response spectra (5% damping) for four motions recorded on hanging wall of fault.
3.5 Observations of rigid bodies providing insight into ground motion characteristics
a. Rotation of Monumental Stone Block in Paganica
The response of massive block-type monuments to strong ground shaking may provide valuable information on the characteristic of strong motion [Yegian et al., 1994, Athanasopoulos, 1995]. An interesting case of response of a stone monument to the main shock of April 6, 2009 was observed in Paganica (42.358616N, 13.471250E), about 11 km east of the epicenter.
The particular monument consists of a block of porous stone with dimensions 0.75 m x 0.75 m x 1.12 m, sitting on a level stone pedestal made of similar material (Figure 3.8). As a result of the main shock, the block rotated about 14deg counter-clockwise (Figure 3.9) leading to a maximum sliding at the edge of the stone of approximately 20 cm. The final position of the block was almost aligned with NS direction. As the coefficient of friction is not less than 0.4, peak ground acceleration at the site may have been higher than 0.4g. More analysis is needed to back calculate additional ground motion parameters.
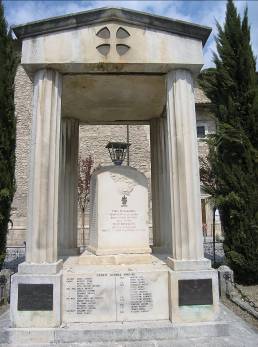 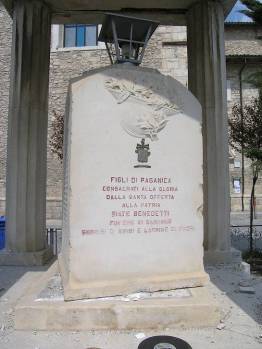
Figure 3.8. Rotated monument in Paganica
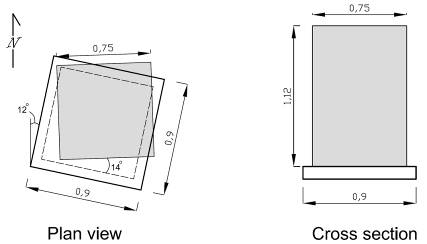
Figure 3.9. Plan view and cross section of stone monument showing initial and aftershock positions.
b. L'Aquila Cemetery: Response of Tombs and Structures
Response of grave markers and other ornamental objects in the meizoseismal area of an earthquake may provide useful information as to intensity and direction of major shaking [Yegian et al., 1994, Athanasopoulos, 1995]. Our reconnaissance team visited L'Aquila cemetery (42.351515N, 13.412318E) on April 15, 2009 to collect pertinent data.
Only a very small portion of grave markers were found damaged as a result of rotation, toppling, or falling (Figure 3.10-3.12). A number of facade ornaments of tombs were broken after falling to the ground. An example is shown in Figure 3.13. The observations in the cemetery seem to indicate that the direction of toppling, breakage and falls is approximately North-South (with deviations of the order of 20 deg).
An interesting example of earthquake response was observed at the mortuary (Camera Mortuaria) of the cemetery shown in Figure 3.14. An ornamental masonry block originally placed at the top of the front facade detached and fell on the ground in S20W direction. The block fell from a height of about 8 m and hit the ground at a horizontal distance of 2.50 m from the building, as shown in Figure 3.14.
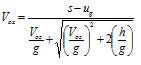
An approximate formula, neglecting air resistance, for back calculating peak horizontal velocity of the fallen object at the time of separation, Vox, is given by the following equation:
where h = height of fall, s = horizontal distance traveled, Voz = vertical velocity at the time of separation, ug = ground movement during fall, g = acceleration of gravity. Using h = 8m, s = 2.5m, g = 10m/s2, and assuming Voz on the order of 0.1 to 0.2cm/s, ug = 0.05m, one obtains the estimate
Vox = 1.9 to 2.0 m/s |
(3.3) |
which is more than five times the maximum recorded PGV in the meizoseismal area. Note that neglecting initial vertical velocity and ground movement, equation (3.2) simplifies to Vox = s/(2 h/g)^0.5, which leads to the almost identical prediction of 1.98m/s. Evidently, the response of the structure, including rocking of the foundation, may have influenced significantly the horizontal velocity of the object. More analyses are required to come up with realistic inversions. Preliminary hand calculations indicate that the amplification due to building response is unlikely to have exceeded 4. This suggests that the peak ground velocity at the site may be higher than those recorded at the accelerographic locations.
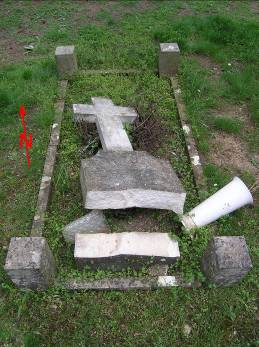 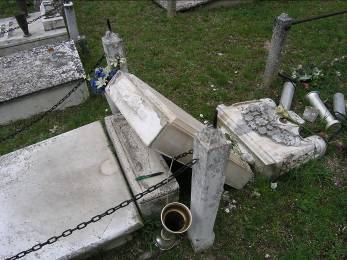
Figure 3.10. Grave markers breakage.
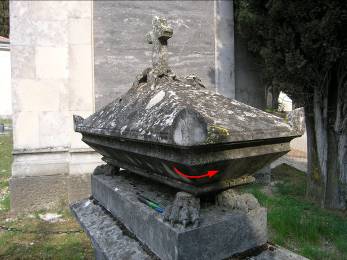
Figure 3.11. Grave marker rotation.
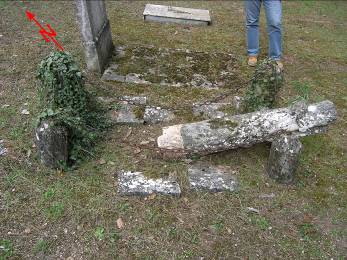 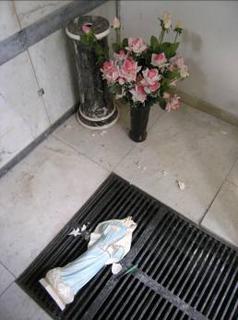
Figure 3.12. Grave markers toppling.
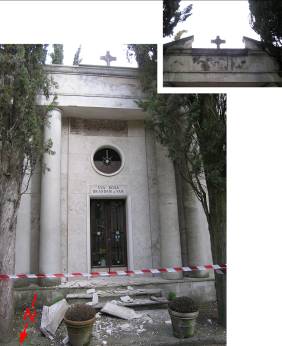
Figure 3.13. Breakage and fall of ornamental objects from a tomb roof.
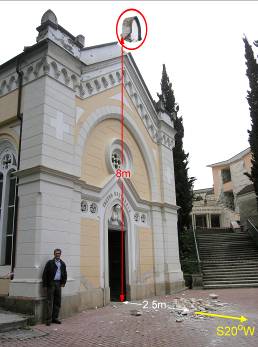
Figure 3.14. Fall of facade object at mortuary building.
|