Mountains surrounding the L'Aquila area are rugged; however, only limited occurrences of significant slope instability were observed. Typically, the failures are localized and minor, with modes including raveling and sloughing of road cuts, quarries, and natural outcrops, permanent displacement of fill embankments, and rock falls. Examples of typical slope failures are summarized below, together with an interesting case of permanent displacement of saturated sediments around the margin of Lake Sinizzo.
The areas investigated by the GEER team for landslide occurrences include the middle Aterno valley south of L'Aquila between two SW-NE sections passing through Paganica (north) and Stiffe (south) and the SW flank of the Aterno valley north of L'Aquila. Our work focused on the southern Aterno valley and in the plateau located to the SW of the Aterno valley (i.e. Altopiano delle Rocche).
-
Rock falls in limestone and marly-sandstone formations, including single blocks (a1), raveling of intensely fractured rock masses of modest (a2) to large (a3) volume.
-
Small slumps/slides and minor raveling/sloughing on cut slopes (road cuts, quarries) in colluviums, cataclastic limestones, slightly cemented breccias/conglomerates, or debris.
-
Debris flow avalanches.
Our observations of instabilities are organized into subsections consistent with the above categories.
5.2.1 Failures of Single Blocks
Ground shaking was sufficient to destabilize loose (and perhaps somewhat precarious) surficial rock blocks that subsequently traveled downhill as rock falls. Falls of this type were observed:
- To the south-east of L'Aquila along both the flanks of Aterno valley in the limestone bedrock (example shown in Figure 5.2a):
- within Fossa village and on the cliffs overlooking the road between Monticchio and Fossa;
- between Paganica and Camarda, see Figure 5.2b from ISPRA (2009a,b);
- at Stiffe village at cave entrance and road above the village (discussed further below);
- along a road from Caporciano to Opi in the southern Aterno valley (see Figure 5.2c from ISPRA (2009a,b).
- To the south-east of L'Aquila in sound conglomerate or breccia layers of the continental deposits at S.Demetrio, Poggio Picenze, and Barisciano.
- To the south-west of L'Aquila in the limestone bedrock:
- along the Raio valley (Lucoli, Casamaina);
- on the Altopiano delle Rocche plateau, on top of the right flank of the Aterno valley (Terranera, Ovindoli);
- along the Eastern flank of Mt. Ocre;
- at Goriano Sicoli.
Relatively detailed investigation and mapping was performed for a rock fall event at the Caves of Stiffe (Grotte di Stiffe). In this case, a large block was liberated from the slope high above this popular tourist area and impacted a concession building (Figure 5.3). The last impact mark of the block prior to impacting a building is at a distance from the building of about 15 m (Figure 5.4), indicating high velocity of the block. Additional impact marks are indicated by an alignment of fresh scars progressing up the hillside (Figure 5.5).
(a) 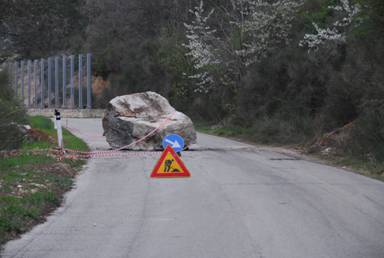 (b)
(b) 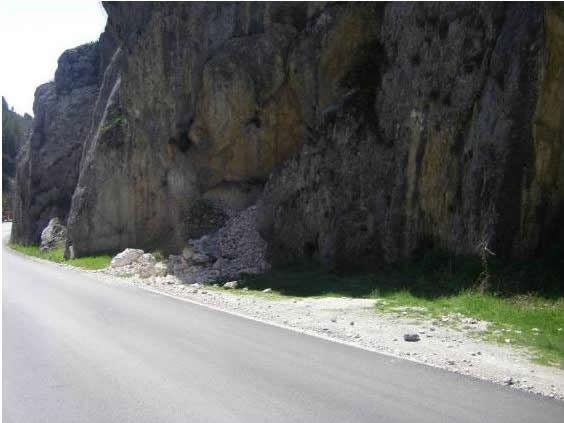
(c) 
Figure 5.2. (a) Large block of a rock fall event (42.266N, 13.585E); (b) rock fall between Paganica and Camarda, (from ISPRA, 2009a,b); (c) rock fall along a road from Caporciano to Opi in the southern Aterno valley (from ISPRA, 2009a,b).
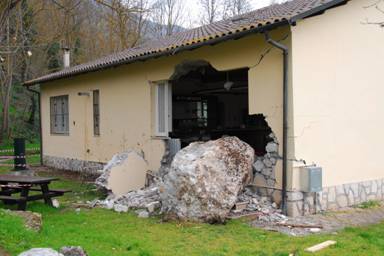
Figure 5.3. Rock fall impact at the Caves of Stiffe (42.255N 13.547E).
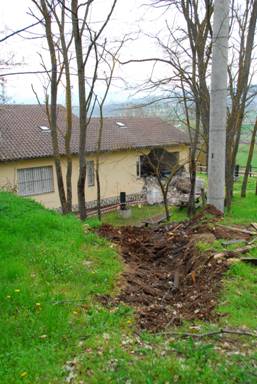
Figure 5.4. Last impact mark prior to impacting building at the Caves of Stiffe; the block trajectory was above the small tree (42.255N 13.547E).
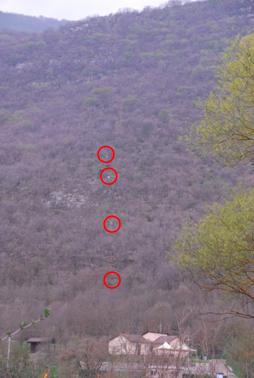
Figure 5.5. Additional impact marks as indicated by an alignment of fresh scars (42.255N 13.547E).
5.2.2 Raveling of modest volume on intensely fractured rock slopes (a3)
Typical raveling-type failures of cut slopes made into the strong and fractured limestone bedrock dominating the local geology are shown in Figures 5.6 and 5.7. The failures involved the uppermost weathered blocks that are bounded by soil-filled joints. These examples are located along SP38 approximately 9.5 km south of L'Aquila. In general, the performance of cut slopes into the limestone bedrock was excellent, and minor surficial failures such as shown were not widespread.

Figure 5.6. Shallow raveling-type failure of weathered limestone blocks (42.278N, 13.467E).

Figure 5.7. Shallow raveling-type failure of weathered limestone blocks (42.278N, 13.468E)
5.2.3 Raveling of large volume on intensely fractured rock slopes (a3)
Relatively large-volume rock falls occurred above Fossa (see Section 4.2 for geology) and Lake Sinizzo (S.Demetrio). As shown in Figure 5.8, the former involved the southern part of a steep limestone cliff and generated a small rock avalanche onto a road. Some outrunner blocks threatened the outermost buildings of Fossa. Figure 5.9 shows the rock cliff above Lake Sinizzo, formed by alterations of gravel and conglomerate layers with intercalations of finer horizons. Differences in strength and erodibility between the materials cause some conglomerate layers to overhang. Shear or tensile failure of the rock layers occurred and generated rock avalanches. The lake is on the prolongation of the Paganica fault and its sides were affected by apparent ground ruptures (see Section 5.3.1).
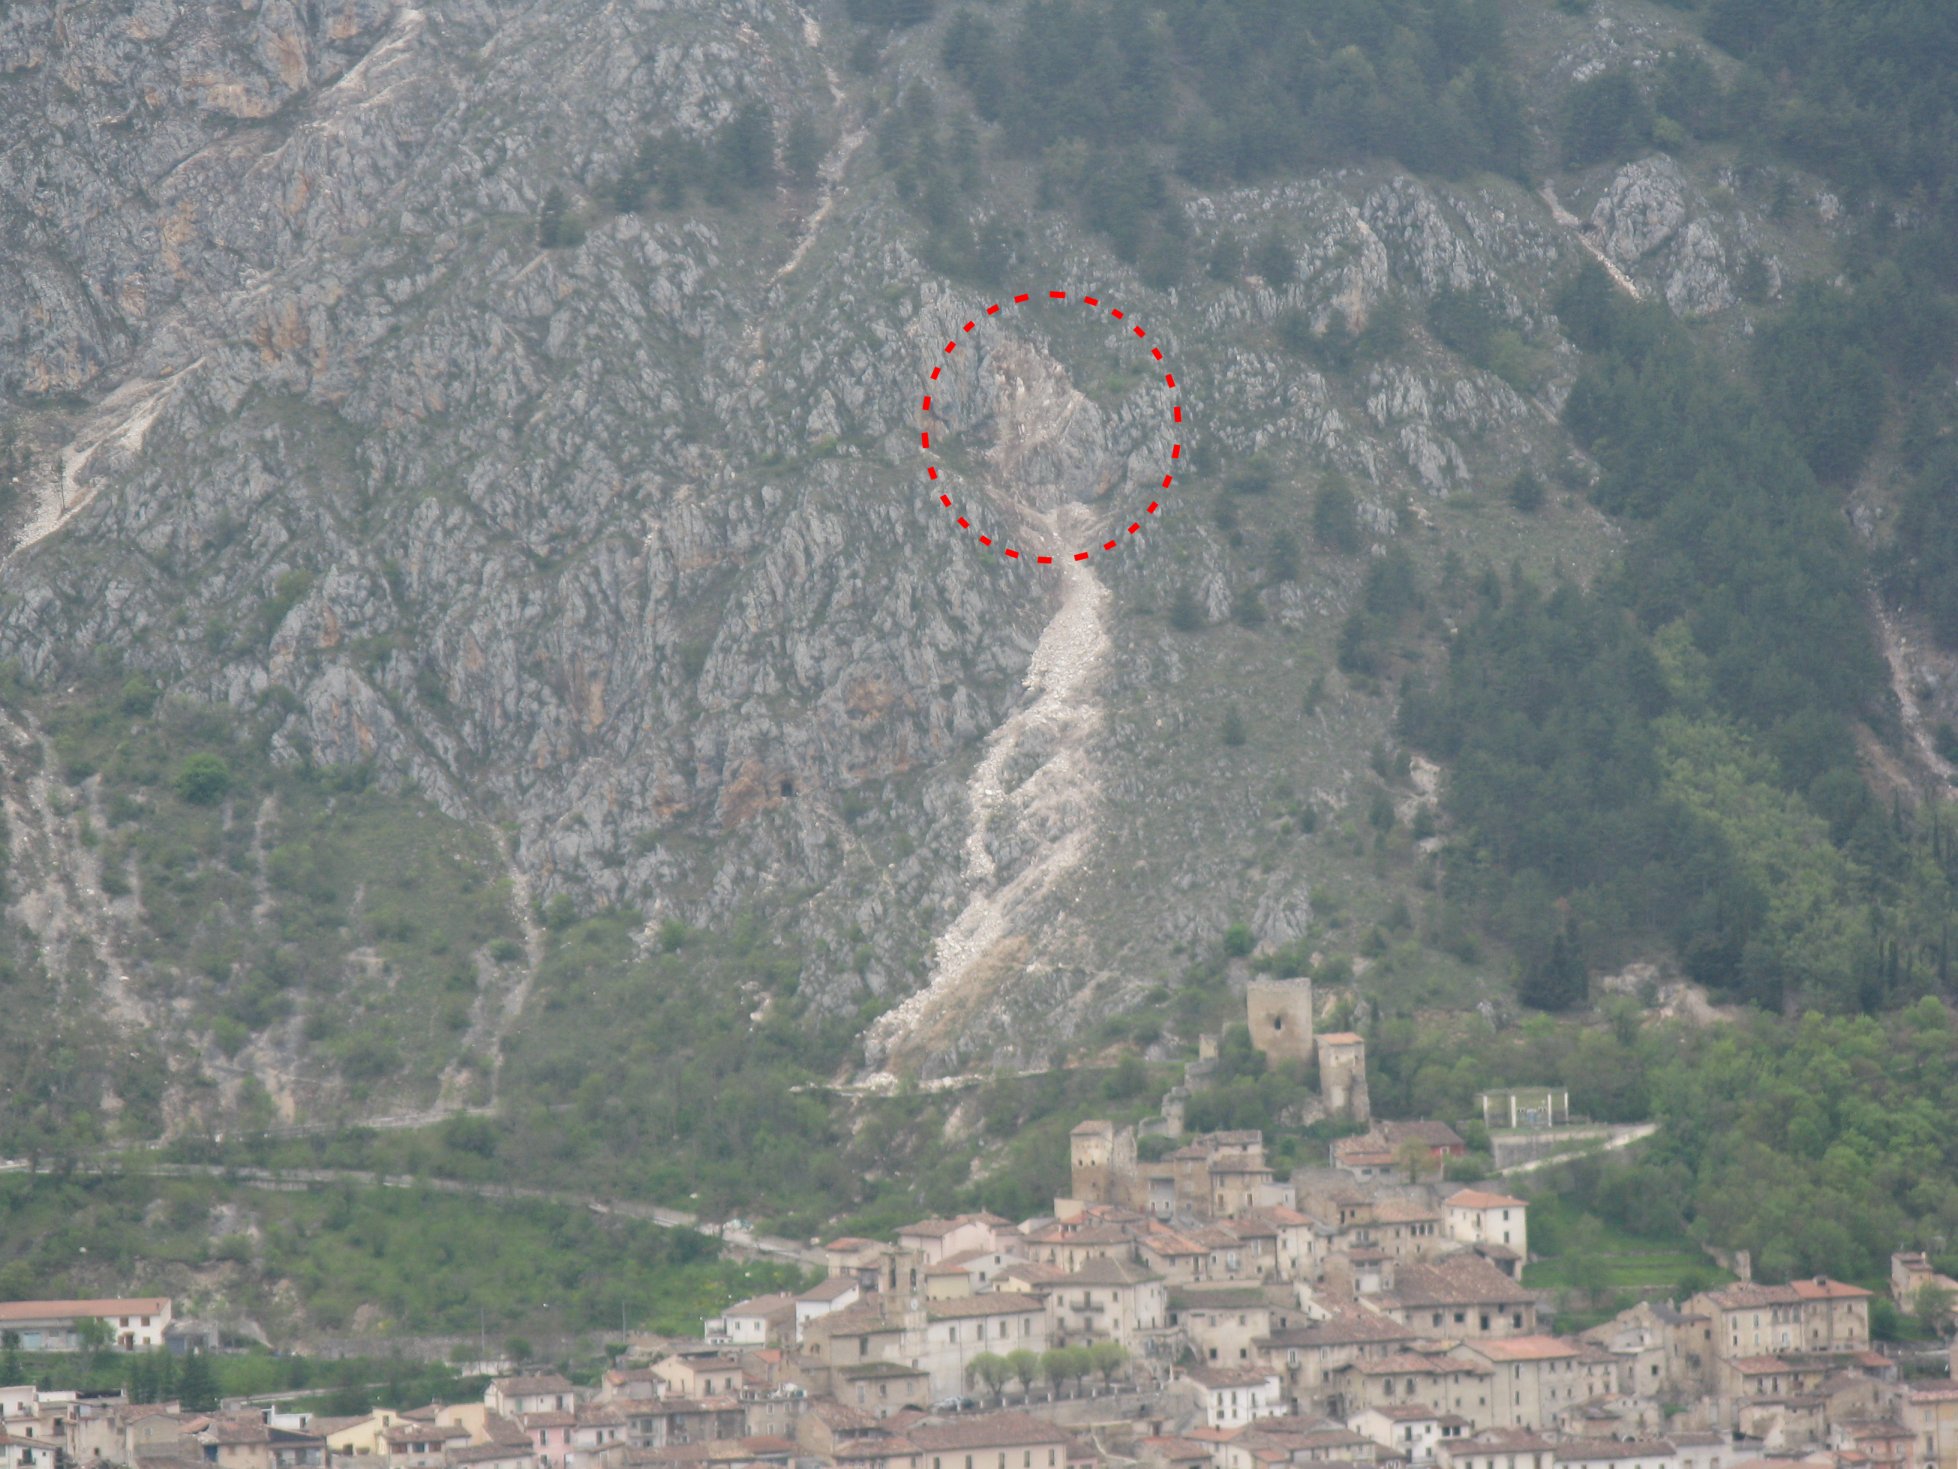
Figure. 5.8. View of Fossa from Mt. Di Cerro. The detachment area of the rock failure that generated the rock avalanche is circled (42.29274N,13.48575E)
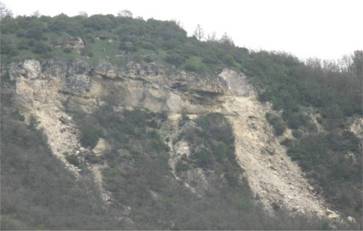
Figure. 5.9. View of the cliff overlooking the northeastern side of the Lake Sinizzo. Two failures in the overhanging thick layers of conglomerates are apparent with the related rock avalanches (42.292N, 13.580E).
5.2.4 Slides and slumps in coarse-grained materials and soft rocks (Type b)
Quarry and road cut faces in these type of materials were found to be affected by raveling, slides and slumps.
Minor raveling of weakly cemented sand and gravel, as depicted in Figure 5.10 and 5.11, occurred locally but significant or deep-seated failures in such deposits was not observed.
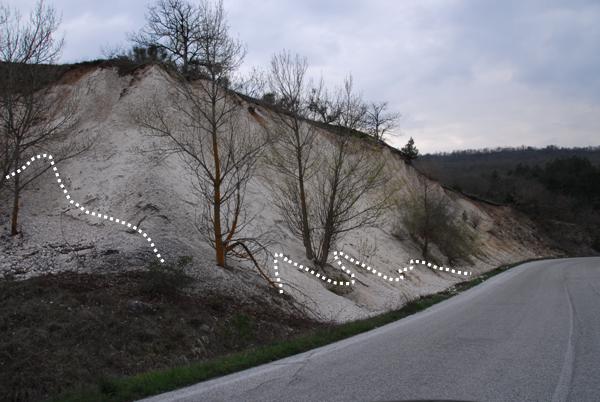
Figure 5.10. Minor raveling of weakly cemented sand and gravel; dashed lines indicate the extent of freshly deposited talus along the base of road cut (Via Opi N42.261, E13.581).
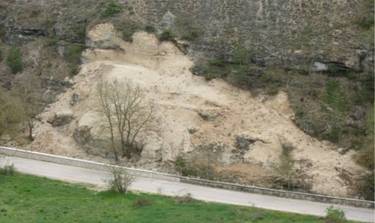
Figure 5.11. Raveling along the road from S. Demetrio to Lake Sinizzo (42.28845N,13.56442E).
Cuts made into silty clayey colluvium also generally performed well, and only minor instances of shallow sloughing as shown in Figure 5.12 was observed.
Figure 5.12. Shallow sloughing of regolith along road cut (southern flank of Castelnuovo N42.294, E13.628).
A larger failure affected a road cut excavated in breccias on the road from Barisciano to S. Stefano di Sessanio (Figure 5.13). Besides the collapsed material the presence of a stepped ground surfaces with apparent tension cracks was observed behind the top of slope.
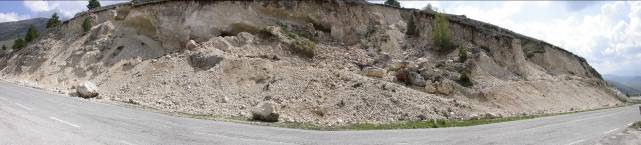
Figure 5.13. Slides and topples along the road from Barisciano to S.Stefano.(DC-11-1; 42.3349N, 13.5796E).
Small slides and raveling occurred also in pervasively jointed limestones (Scaglia formation) on the eastern flank of the hill of Bazzano, which overlooks the SS17 highway (Figure 5.14). Slides did not exceed few tens of m3 but were widespread over the whole slope.
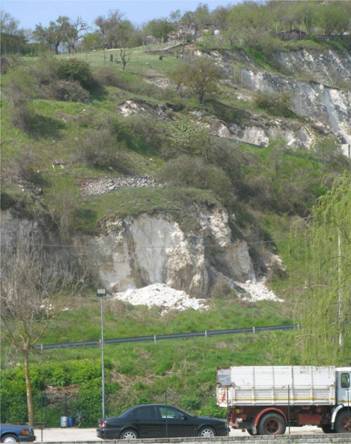
Figure 5.14. Slides on the eastern flank of the Bazzano hill (in the foreground SS17 highway) (42.34005N, 13.45560E).
Several quarries in the region surrounding L'Aquila have been developed in cataclastic geologic units formed along the base of the bounding mountain ranges. Cataclasites are created by the mechanical breakdown of bedrock materials resulting from past major fault activity, and in the region they are typically white to light gray, cemented, with strongly interlocked clasts ranging from fines to boulder sizes. Typical characteristics of the cataclasite, as exposed along the Pettino fault approximately 4.0 km northwest of L'Aquila, are depicted in Figure 5.15.


Figure 5.15. Cataclasite exposed along the Pettino Fault (left) and detail of cemented and interlocked particulate structure (right) (42.376N, 13.365E).
Quarries in the cataclasite were observed in Fossa (Figure 5.16) and northeast of the town of Colle (Figures 5.17 and 5.18). These quarries performed very well, with only localized and insignificant minor raveling.

Figure 5.16. Quarry in Cataclasite with estimated 600 slopes up to approximately 35 m high, located in Fossa (42.300N, 13.485E).
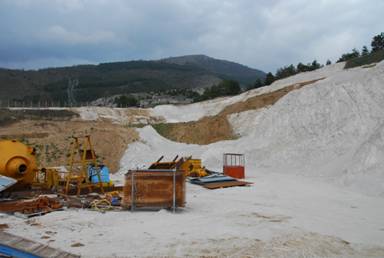
Figure 5.17. Quarry in Cataclasite with near vertical slopes segments up to approximately 15 m high, located northeast of Colle (42.435N, 13.330E).

Figure 5.18. Quarry in Cataclasite with estimated 500 slopes up to approximately 60 m high, located northeast of Colle (42.437N, 13.328E).
Small slides on cut faces of abandoned quarries in pervasively fractured/cataclastic limestones were observed on the SS80 State highway uphill from Arischia (Figures 5.19 and 5.20).

Fig. 5.19. Slide of a small wedge in cataclastic limestones on the SS80 at km 16.5, uphill from Arischia (42.41973N, 13.34926E)
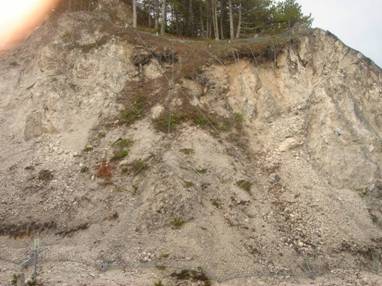
Figure 5.20. Raveling in pervasively fractured/cataclastic limestones on a road cut retained by steel-net protections on SS80 at km 18.2: (DC-18-1) (42.4281N, 13.3460E).
Approximately 300 m east of the quarry depicted in Figure 5.16, and continuing along the base of the northwest-trending mountain range, are natural outcrops of the cataclasite. The outcrops are recognizable by their characteristic white to light gray erosional scars (Figure 5.21). Although the natural slopes also experienced only minor and localized raveling-type failures, their occurrence (Figure 5.22) is greater than observed in the nearby cataclasite quarries. This is potentially attributable to the relative absence of weak and weathered near-surface material in the quarries, having already been removed by mining operations. In the same area, failures were observed on the road from Fossa to the S. Angelo D'Ocre convent (Figure 5.23).

Figure 5.21. Characteristic erosional scars developed in cataclasite (42.434N, 13.334E).
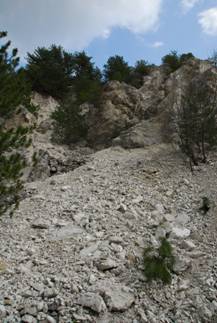
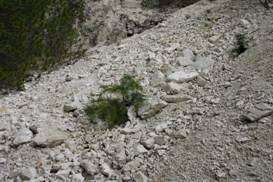
Figure 5.22. Characteristic raveling-type failure in natural outcrops of cataclasite; partially buried pine trees evidence recent movement (42.434N, 13.334E).
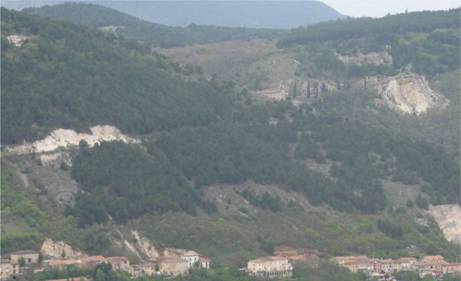
Figure. 5.23. Slides in cataclasites along the road from Fossa to S.Angelo d'Ocre. Detail of the spur on the right is in Fig 5.24 (42.29694N, 13.48469E).
Near the convent, raveling was observed at the base of a natural rock spur (Figure 5.24), which is affected by persistent subvertical fractures isolating large prisms that are backward tilted by a larger block slump. This area is reported as a landslide area in the 1:50000 geological map (sheet 359). Therefore excepting for the raveling (that was surely caused by the earthquake), re-activation or triggering of larger phenomena is to be clarified through aerial photo interpretation and direct surveys that were not possible due to the closure of the road.
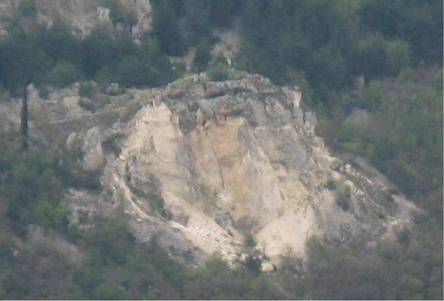
Figure. 5.24. Detail of Fig. 5.23 showing the rock spur near the S.Angelo convent (42.30087N, 13.47829E).
5.2.5 Debris Flows (Type c)
Landslides occurred on the southern flank of Mt. San Franco (to the north-east of L'Aquila) and crossed the SP86 highway between Assergi and Capannelle Pass. The area had been affected by debris flows involving the talus debris as the image in Figure 5.25 taken before the earthquake illustrates. In the days following the earthquake the debris flows re-activated and a slide mass consisting of debris and snow/ice invaded the road (Figure 5.26).
The role of the earthquake is to be clarified; in fact the debris flows are not co-seismic with the mainshock. Their triggering can be due to the combined action of the aftershocks and the severe rainfall conditions occurred in the days following the main event seismic event. Furthermore it is worth noting that the snow depths were unusually high for the mid-April time frame of these observations. The role of the mainshock in triggering snow avalanches deposited on the debris cannot be excluded at the moment.
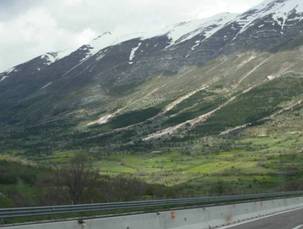
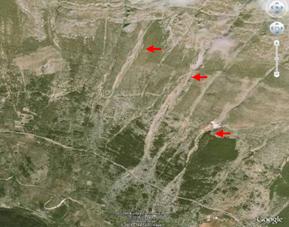
Figure. 5.25. Left. view of the Mt. San Franco flank on 4-30-2009. Right: image from Google Earth taken before the earthquake showing the debris flows (42.4368N, 13.5796E).
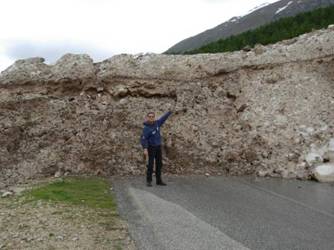
Figure. 5.26. Debris flow body invading the SP86. (Courtesy of Dr. Roberta Giuliani, DPC-SISM) (42.4368N, 13.5796E).
5.3 Embankments and Fills
Few observations of side-hill fill embankment failures were made, with the exception of failures within a series of tight switchbacks along an unpaved rural access road located approximately 8.0 km north of L'Aquila. Headscarps of the failures, as depicted in Figures 5.27 and 5.28, appear to coincide with the approximate cut-fill contact. Corresponding maximum lateral and vertical displacements are estimated at about 2.0 m and 1.0 m, respectively.

Figure 5.27. Failure of side-hill fill embankment (42.420N 13.376E).
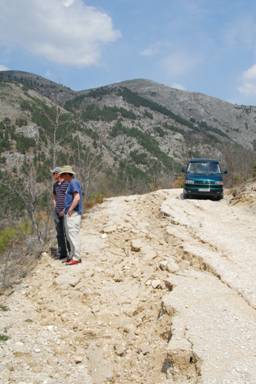
Figure 5.28. Failure of side-hill fill embankment (42.420N 13.376E).
Along the Aterno River and south and west of Onna are two bridges that suffered significant damage and complete collapse, respectively. In both cases, evidence of ground failure was observed in the abutment areas. The failures were represented as fissures oriented approximately parallel to the river alignment, developed in the alluvial floodplain at distances up to about 150 m from the river (Figure 5.29). Additionally, significant ground cracking was observed along the approach fills and foundation abutment/flood protection levee, with orientations tending parallel to the local strike of slope.

Figure 5.29. Ground fissures developed in alluvial floodplain directly south of central Onna and approximately 150 m from the Aterno River. Orientation of fissures is approximately parallel to the river (42.325N, 13.480E).
Along the approach road to the bridge directly south of Onna are a series of about ten cracks oriented parallel to the river alignment and at distances ranging in the range of about 15 to 160 m from the Aterno River (Figure 5.30). The cracks are primarily tensional, extending through the asphalt but not into the sub-base or approach fill embankment (Figure 5.31). These cracks, together with those such as depicted in Figure 5.29, record permanent ground displacement that is considered consistent with the possibility of minor lateral spreading of the alluvial floodplain sediments toward the Aterno River.
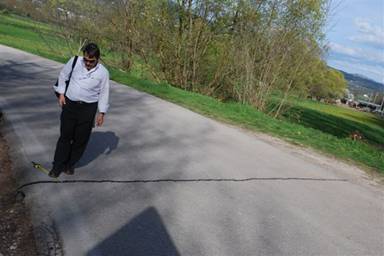
Figure 5.30. Characteristic crack developed in bridge approach road directly south of Onna, at distances of 15 m to 160 m from the Aterno River (42.324N, 13.478E).
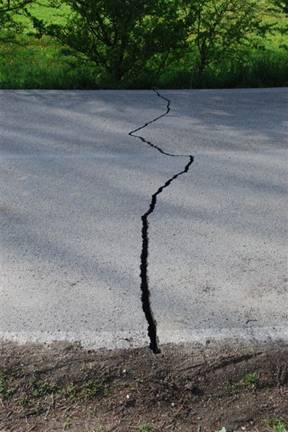
Figure 5.31. Typical tensile condition of road cracks such as depicted in Figure 5.15, not extending into neighboring sub-base or approach fill embankment (42.324N, 13.478E).
Adjacent to the bridge abutment south of Onna, significant but localized cracking of the flood protection levee was observed, as shown in Figures 5.32 and 5.33. The observed cracks are oriented subparallel to the Aterno River and are consistent with permanent displacement toward the free faces of the levee.
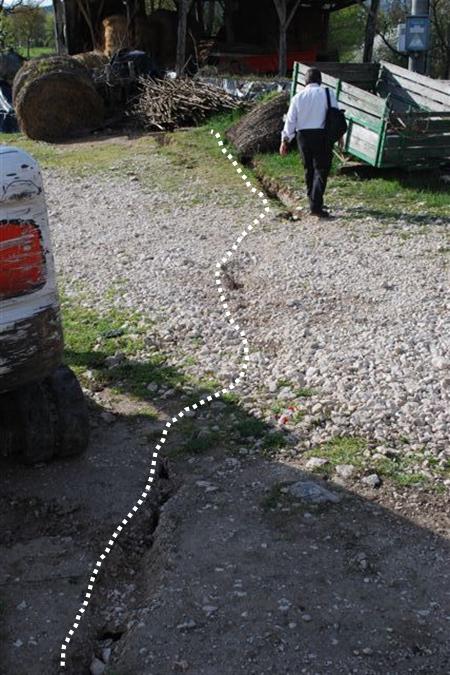
Figure 5.32. Ground cracks up to 1.0 m deep, 20 m long, and with maximum 0 15 cm vertical displacement (down-dropped toward river) developed directly adjacent to bridge abutment (42.324N, 13.478E).
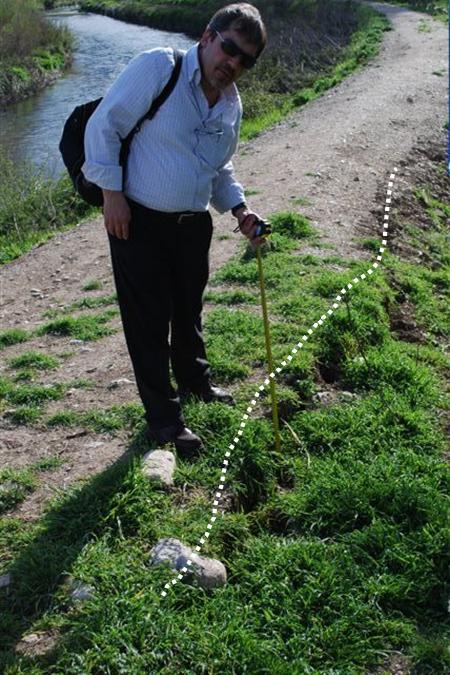
Figure 5.33. Ground cracks developed along levee crest adjacent to bridge abutment (42.324N, 13.478E).
Approximately 1.3 km upstream and east of the ground failures summarized in Figures 5.29 through 5.33 is the site of a bridge collapse, north of the town of Monticchio (Figure 5.34). The approach fill exhibits linear cracks along the road shoulder that indicate on the order of 10-15 cm of permanent lateral displacement toward the local free face condition (Figure 5.35).
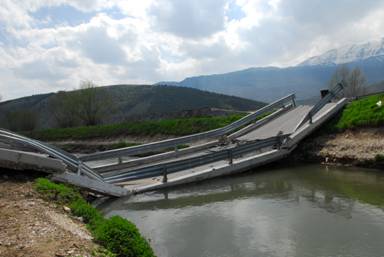
Figure 5.34. Bridge collapse along the Aterno River, approximately 450 m north of Monticchio (42.325N, 13.463E).

Figure 5.35. Approximately 15-20 cm lateral displacement of approach fill (42.325N, 13.463E).
Although the flood protection levee has side slopes up to about 1.25:1 (horizontal to vertical) and appeared to be in a rather loose condition at the surface, the levee generally performed well in the area of the bridge failure (Figure 5.36). An exception is the western abutment on the northern side of the river. As depicted in Figure 5.37, directly beneath the abutment a levee crack having a maximum width of about 6 cm and down-dropped 2-3 cm toward the river developed. From the observations made, it is not clear if the levee damage occurred first and possibly contributed to the collapse, or if the deck collapse enabled localized failure of the levee.
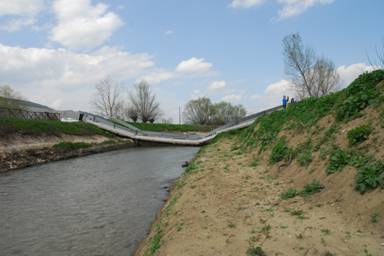
Figure 5.36. Flood protection levee in vicinity of bridge collapse (42.325N, 13.463E).
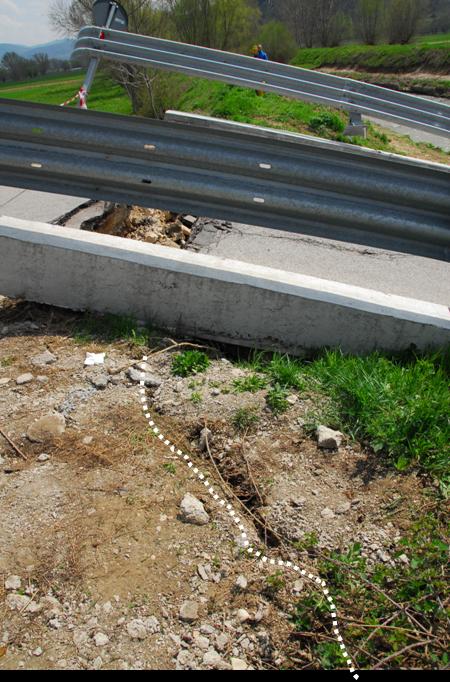
Figure 5.37. Ground cracking in levee directly beneath western abutment along northern side of Aterno River (42.325N, 13.463E).
Within the cataclasite quarry northeast of Colle and depicted in Figure 5.17, two parallel shear failures in clayey sand fill materials were observed (Figure 5.38). The shear failures are oriented perpendicular to the free face of the fill slope, have approximately 15 m separation, with vertical displacement systematically increasing to a maximum of about 40 cm toward the free face. A block of soil between the parallel shears has dropped down, forming a graben structure (Figure 5.39), but a distinctive headscarp has not developed. These structural relations would not be expected for usual soil slope failure modes, and further inspection indicates the shear failures resulted from differential seismic compression of the fill.
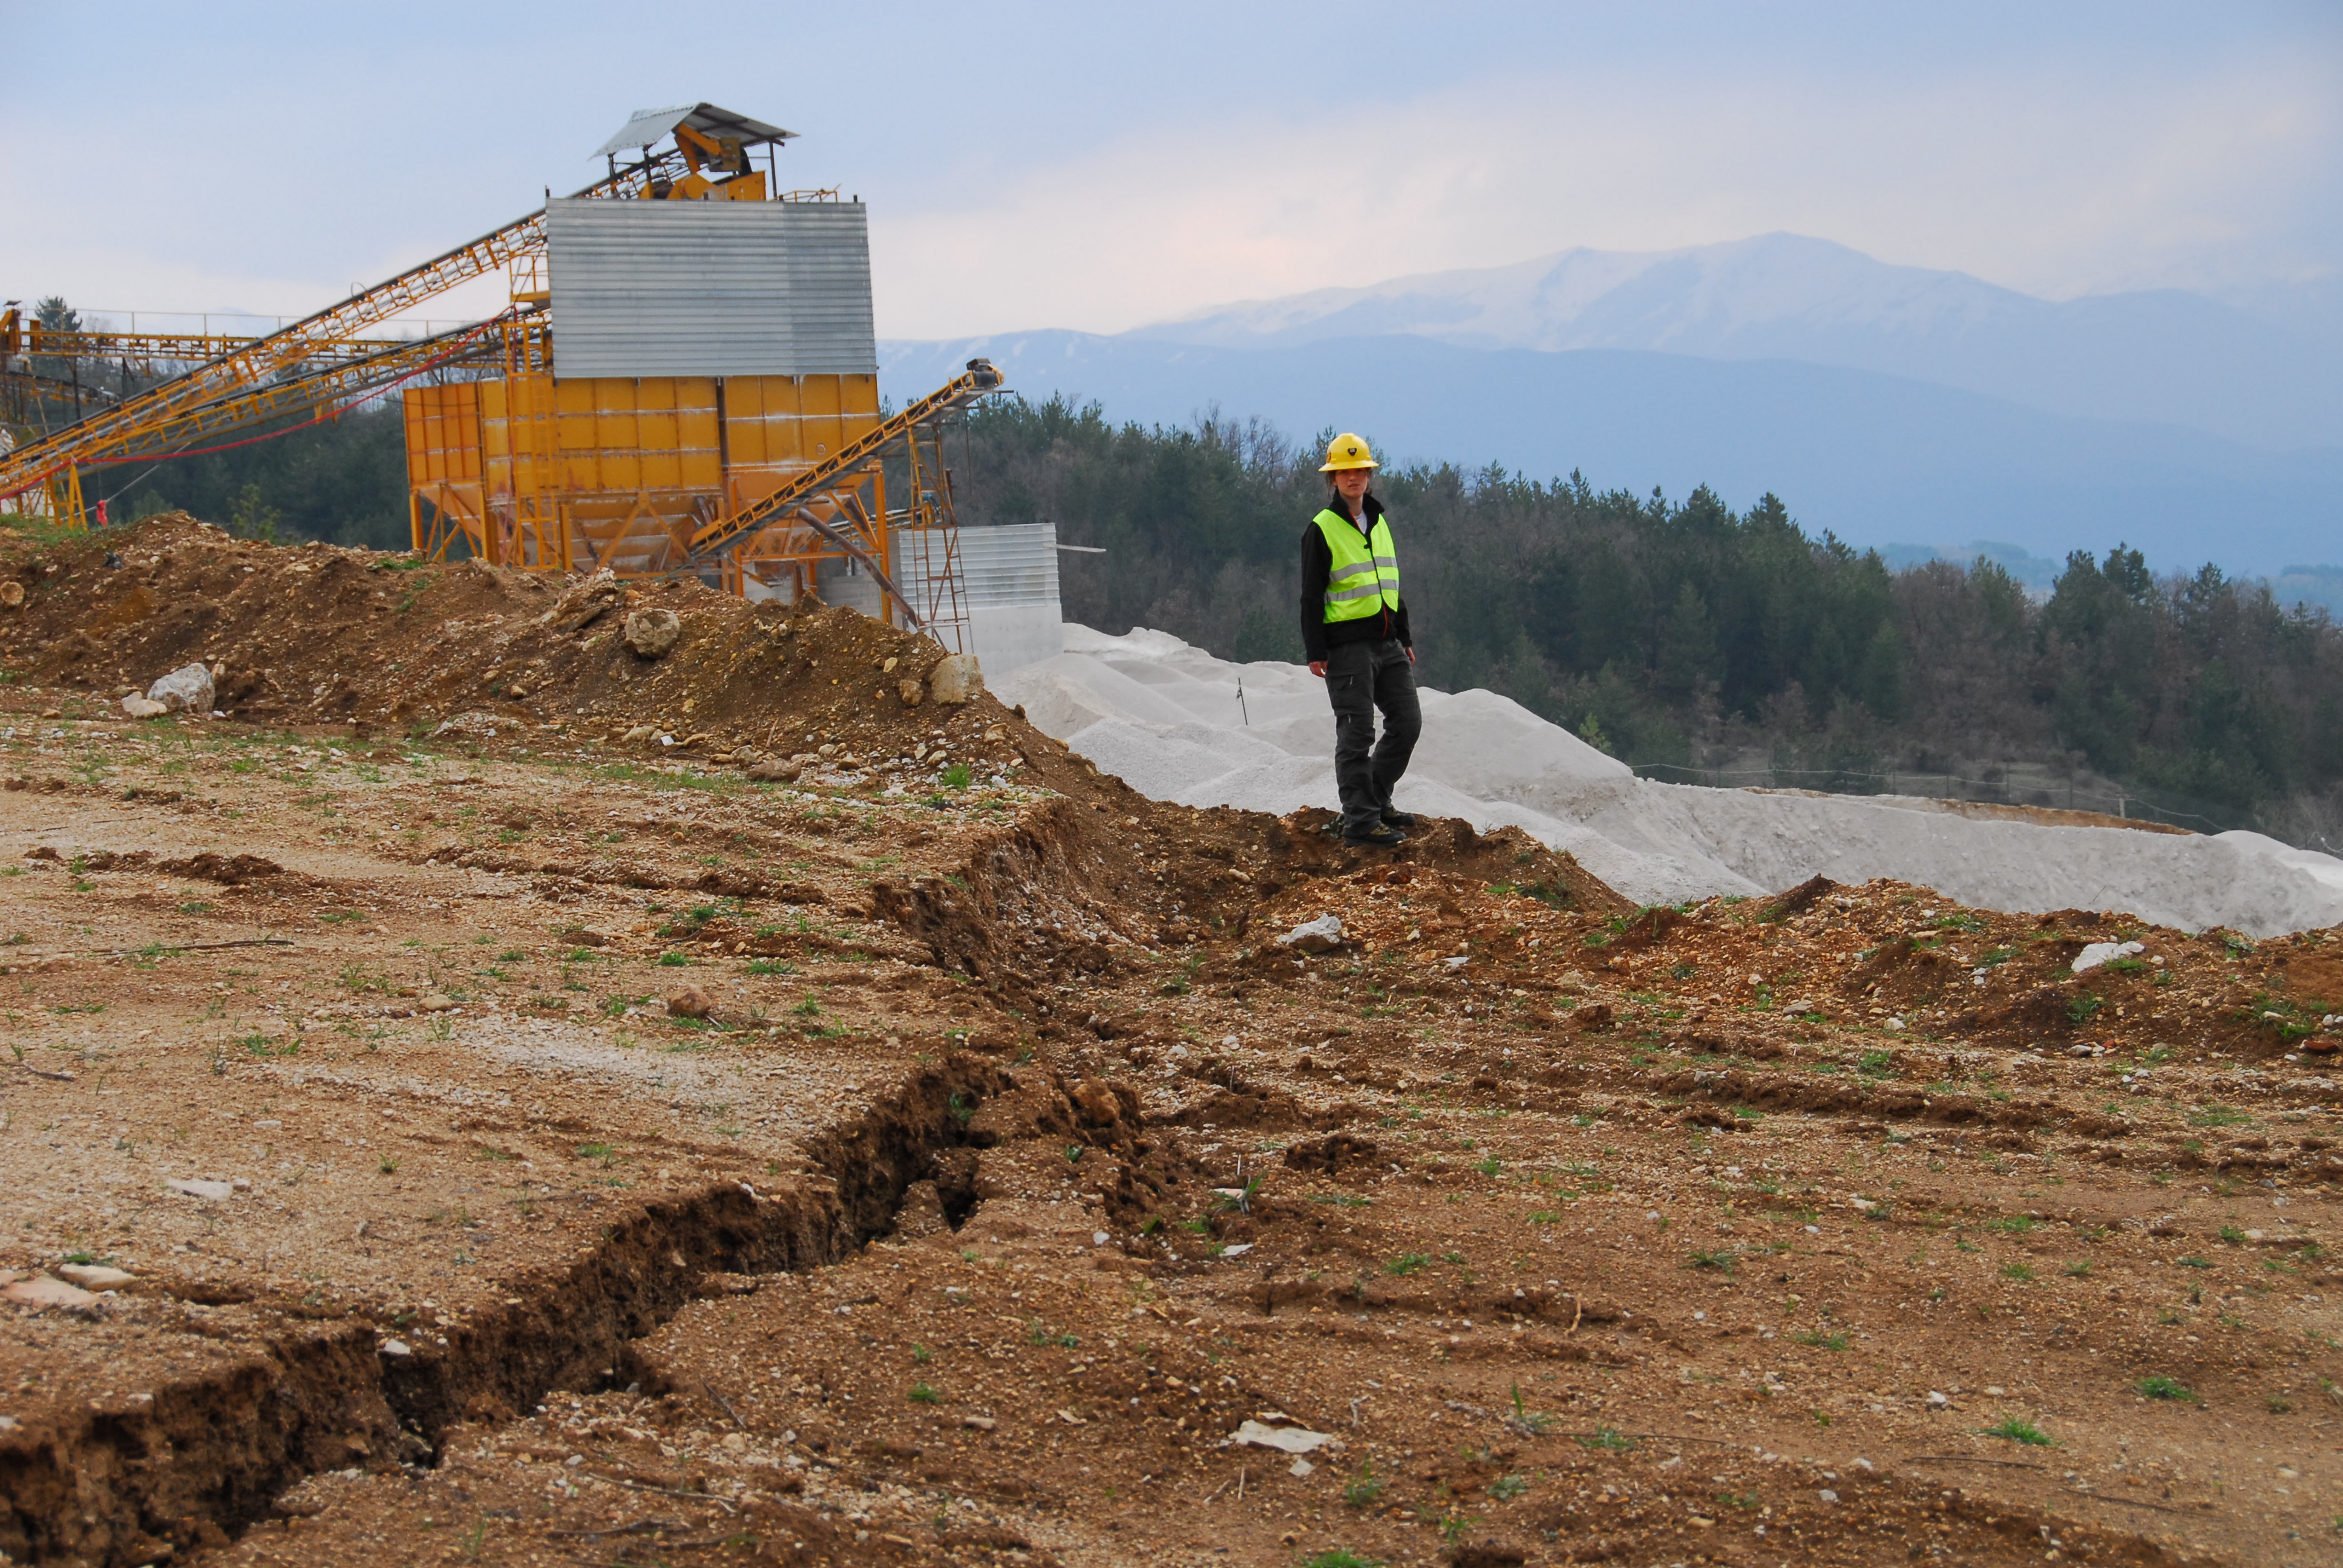
Figure 5.38. Shear failure developed in fill material, with vertical displacement increasing to approximately 40 cm at free slope face (42.435N, 13.330E).
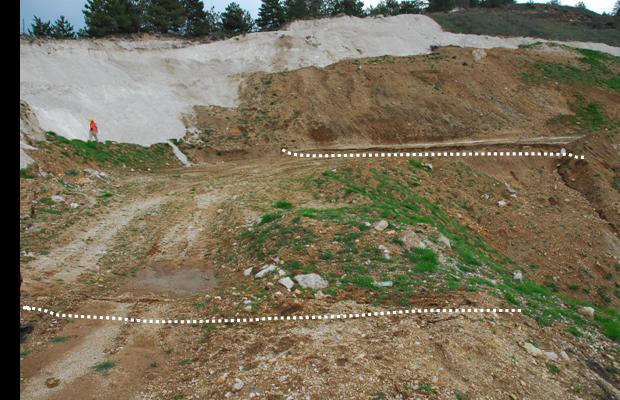
Figure 5.39. Graben structure (between lines) created by parallel down-dropped shears (42.435N, 13.330E).
Figure 5.40 reveals that the fill material has been placed in a tight bedrock notch, and considering the nature of mining operations it was likely loose dumped and poorly compacted. The boundary conditions, with very steep bedrock sidewalls, promote differential settlement due to seismic compression. In this case the resulting shear strain appears to have been sufficient to cause shear rupture through the soil.


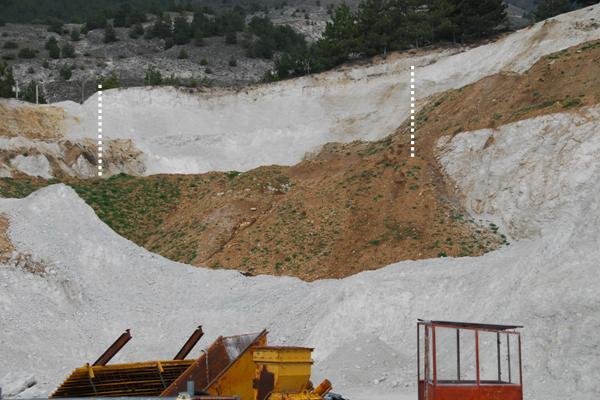
Figure 5.40. Graben structure (between vertical lines) and bedrock boundary conditions (42.435N, 13.330E).
Effects of differential compaction were also observed in boulder fill placed along the sidewalls of a cut-and-cover tunnel structure located about 1.5 km northeast of L'Aquila. As shown in Figure 5.41, the boulder fill is of fairly uniform particle size, and Figure 5.42 shows the amount of settlement (10 to 15 cm) relative to the spanning parapet wall foundation. Some of this settlement may have existed prior to the earthquake. Fresh cracks in the overlying asphaltic surfaces and a narrow settlement trend along the sidewall of the cut-and-cover structure may indicate the boulder fill is continuous and not just at the portals (Figure 5.43).
Figure 5.41. Boulder fill placed along side wall of cut-and-cover structure (42.358N 13.415E)
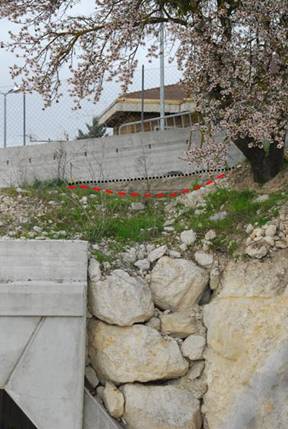
Figure 5.42. Settlement trough reaching 10 to 15 cm maximum, relative to the spanning parapet wall foundation (42.358N 13.415E).

Figure 5.43. Cracks in the overlying asphaltic surfaces and a narrow settlement trend along the sidewall of the cut-and-cover structure (42.358N 13.415E).
Minor instances of utility trench backfill such as depicted in Figure 5.44 were observed sporadically.
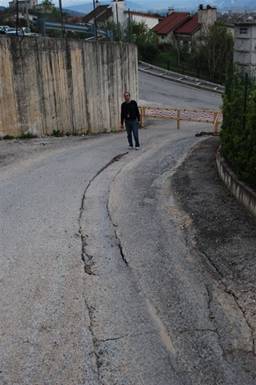
Figure 5.44. Seismic compression of trench backfill in the town of Paganica (42.365N, 13.465E).
5.4 Lake Sinizzo
5.4.1 General observations during field reconnaissance
Lake Sinizzo (42deg17'27.23", 13deg 34'35.05") is situated in a natural karstic depression located east of San Demetrio ne Vestini. The lake is roughly circular in plan view, with an average diameter of approximately 120 m. The lake appears to be partially impounded by a small embankment located as shown in Figure 5.45. A bathymetry survey by Tete et al. (1984) is shown in Figure 5.46, indicating maximum side slope relief of about 10 m.


Figure 5.45. Overview of Lake Sinizzo with location of impounding embankment indicated by vertical white line (42.291N 13.576E).

Figure 5.46. Bathymetric survey of Lake Sinizzo; impounding embankment at upper left corner (Tete et. al, 1984).
Significant ground cracking was observed along approximately 70-80 percent of the lake perimeter, such as depicted in Figures 5.47 and 5.48. Soils exposed in the sidewalls of the ground cracks are visually classified as clayey gravel (GC) to gravelly clay (CH), with notable high plasticity of the fines. These materials may have a mixed alluvial/lacustrian origin, and artificial near surface fill may exist locally.

Figure 5.47. Ground cracks along the northwestern perimeter of Lake Sinizzo (42.291N, E13.576).
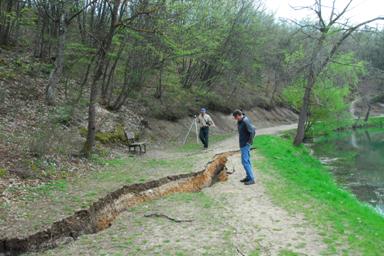
Figure 5.48. Ground cracks along the eastern perimeter of Lake Sinizzo (42.291N, E13.576).
Several meters of local slope displacement are evidenced by submerged trees and a prominent arcuate landslide scar near the western margin of Lake Sinizzo (Figure 5.49). Pre-and-post earthquake imagery, shown in Figures 5.45 and 5.50, respectively, indicate that submergence occurred as a result of slope displacement during the earthquake.
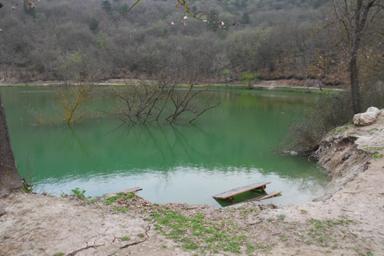
Figure 5.49. Submerged trees located several meters from the western margin of Lake Sinizzo; picnic table within arcuate landslide scar at shoreline. (42.291N 13.576).

Figure 5.50. Post earthquake satellite imagery showing submerged trees within small circle and rock slope failures within large circle; compare to pre-earthquake imagery shown in Figure 5.35 (42.291N 13.576).
5.4.2 Tape and compass displacement measurements
Tape and compass measurements were performed to document permanent surface deformations along the banks of Lake Sinizzo. Linear traverses were measured utilizing a standard 60 m fibreglass tape and a Brunton Compass for each failure zone from the approximate shore line to the furthest observed ground cracks. The distance to each crack along the traverse and its opening were documented. Cracks with a minimum opening were assigned an opening of 1 mm.
The measurements were performed on 15 April 2009, 9 days after the mainshock. The first observations made by the reconnaissance group were on the 11 April 2009 and no significant changes were observable by 15 April based on observations as well as comparing photographs. As an example, Figure 5.51 shows the same ground deformations at the southwest corner of Lake Sinizzo (WP 18) photographed during each site visit. The camera position and lighting conditions were slightly different for the two photographs giving rise to slight differences between the two images.
a. 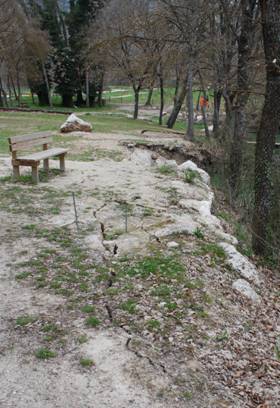 b.
b. 
Figure 5.51. Ground cracks at the southwest corner of Lake Sinizzo (location WP 18) as observed on (a) 11 April 2009 and (b) 15 April 2009.
Thirteen locations associated with ground failures were surveyed resulting in 19 data sets. The GPS waypoint (WP) for each location is indicated in Figure 5.52. Two way points are associated with multiple traverses for assessing the variability of the deformation within a single failure zone. This process was discontinued due to time constraints and the information related to the spatial variability was acquired by laser scanning (Section 5.4.3). Sixteen of the measurement locations consisted of a linear traverse. The other three consisted of a system of fine cracks (WP 20), a single slump with no observable cracks in the block (WP 29), and a park bench (WP 31) associated with local ground surface deformation at base of a slope within a zone of permanent surface deformation. Waypoint 21 marks the top of the direct slope above the failures associated with Waypoints 22, 30,31, and 32.

Figure 5.52. GPS way points indicating measurement locations around Lake Sinizzo. The red arrows indicate the orientation and maximum cumulative crack opening measured at each location.
The results from the measurement campaign are available in both table and graphical format for each traverse in the appendix for this section. The corresponding waypoint, location, and the orientation of the measurement line are included in each table. The distance represents the location of each crack determined to be associated with slope deformations from the lake shore or the slope leading directly to the water surface. Desiccation cracks were identified based on the crack characteristics and patterns and are not included in the data sets. The opening associated with individual cracks crossing the traverse was measured at the intersection parallel to the traverse orientation. In some cases the opening may contain a component of shear displacement along the individual crack when the crack crosses the traverse obliquely.
The traverse length was based on the crack furthest from the lake shore. For way points with a single traverse, and the longest traverse within a multi-traverse location, the measured distance represents the maximum length of the displaced mass based on observable surface extension. The crest of the head scarp was identified and the tape was extended to the shore along the orientation normal to the crack orientation. The cumulative extension represents the total opening in the orientation of the traverse along its complete length. Each table is associated with a figure plotting the presented data. Table 5.1 summarizes the traverse lengths and the cumulative crack opening for all measured traverses. The cumulative opening for the traverses at WP 24, WP25, WP26, and WP 27 are minimum values; opening distance was not measured across displaced blocks that had moved into and under the water surface. Figure 5.53 shows an example of a block lying just below the waters surface near the end of the traverse WP 25. The location of Traverse WP 26 and WP 27 are also indicated on this figure.
Table 5.1. Summary of the length, cumulative crack opening and the orientation of the 17 traverses and their corresponding way point.

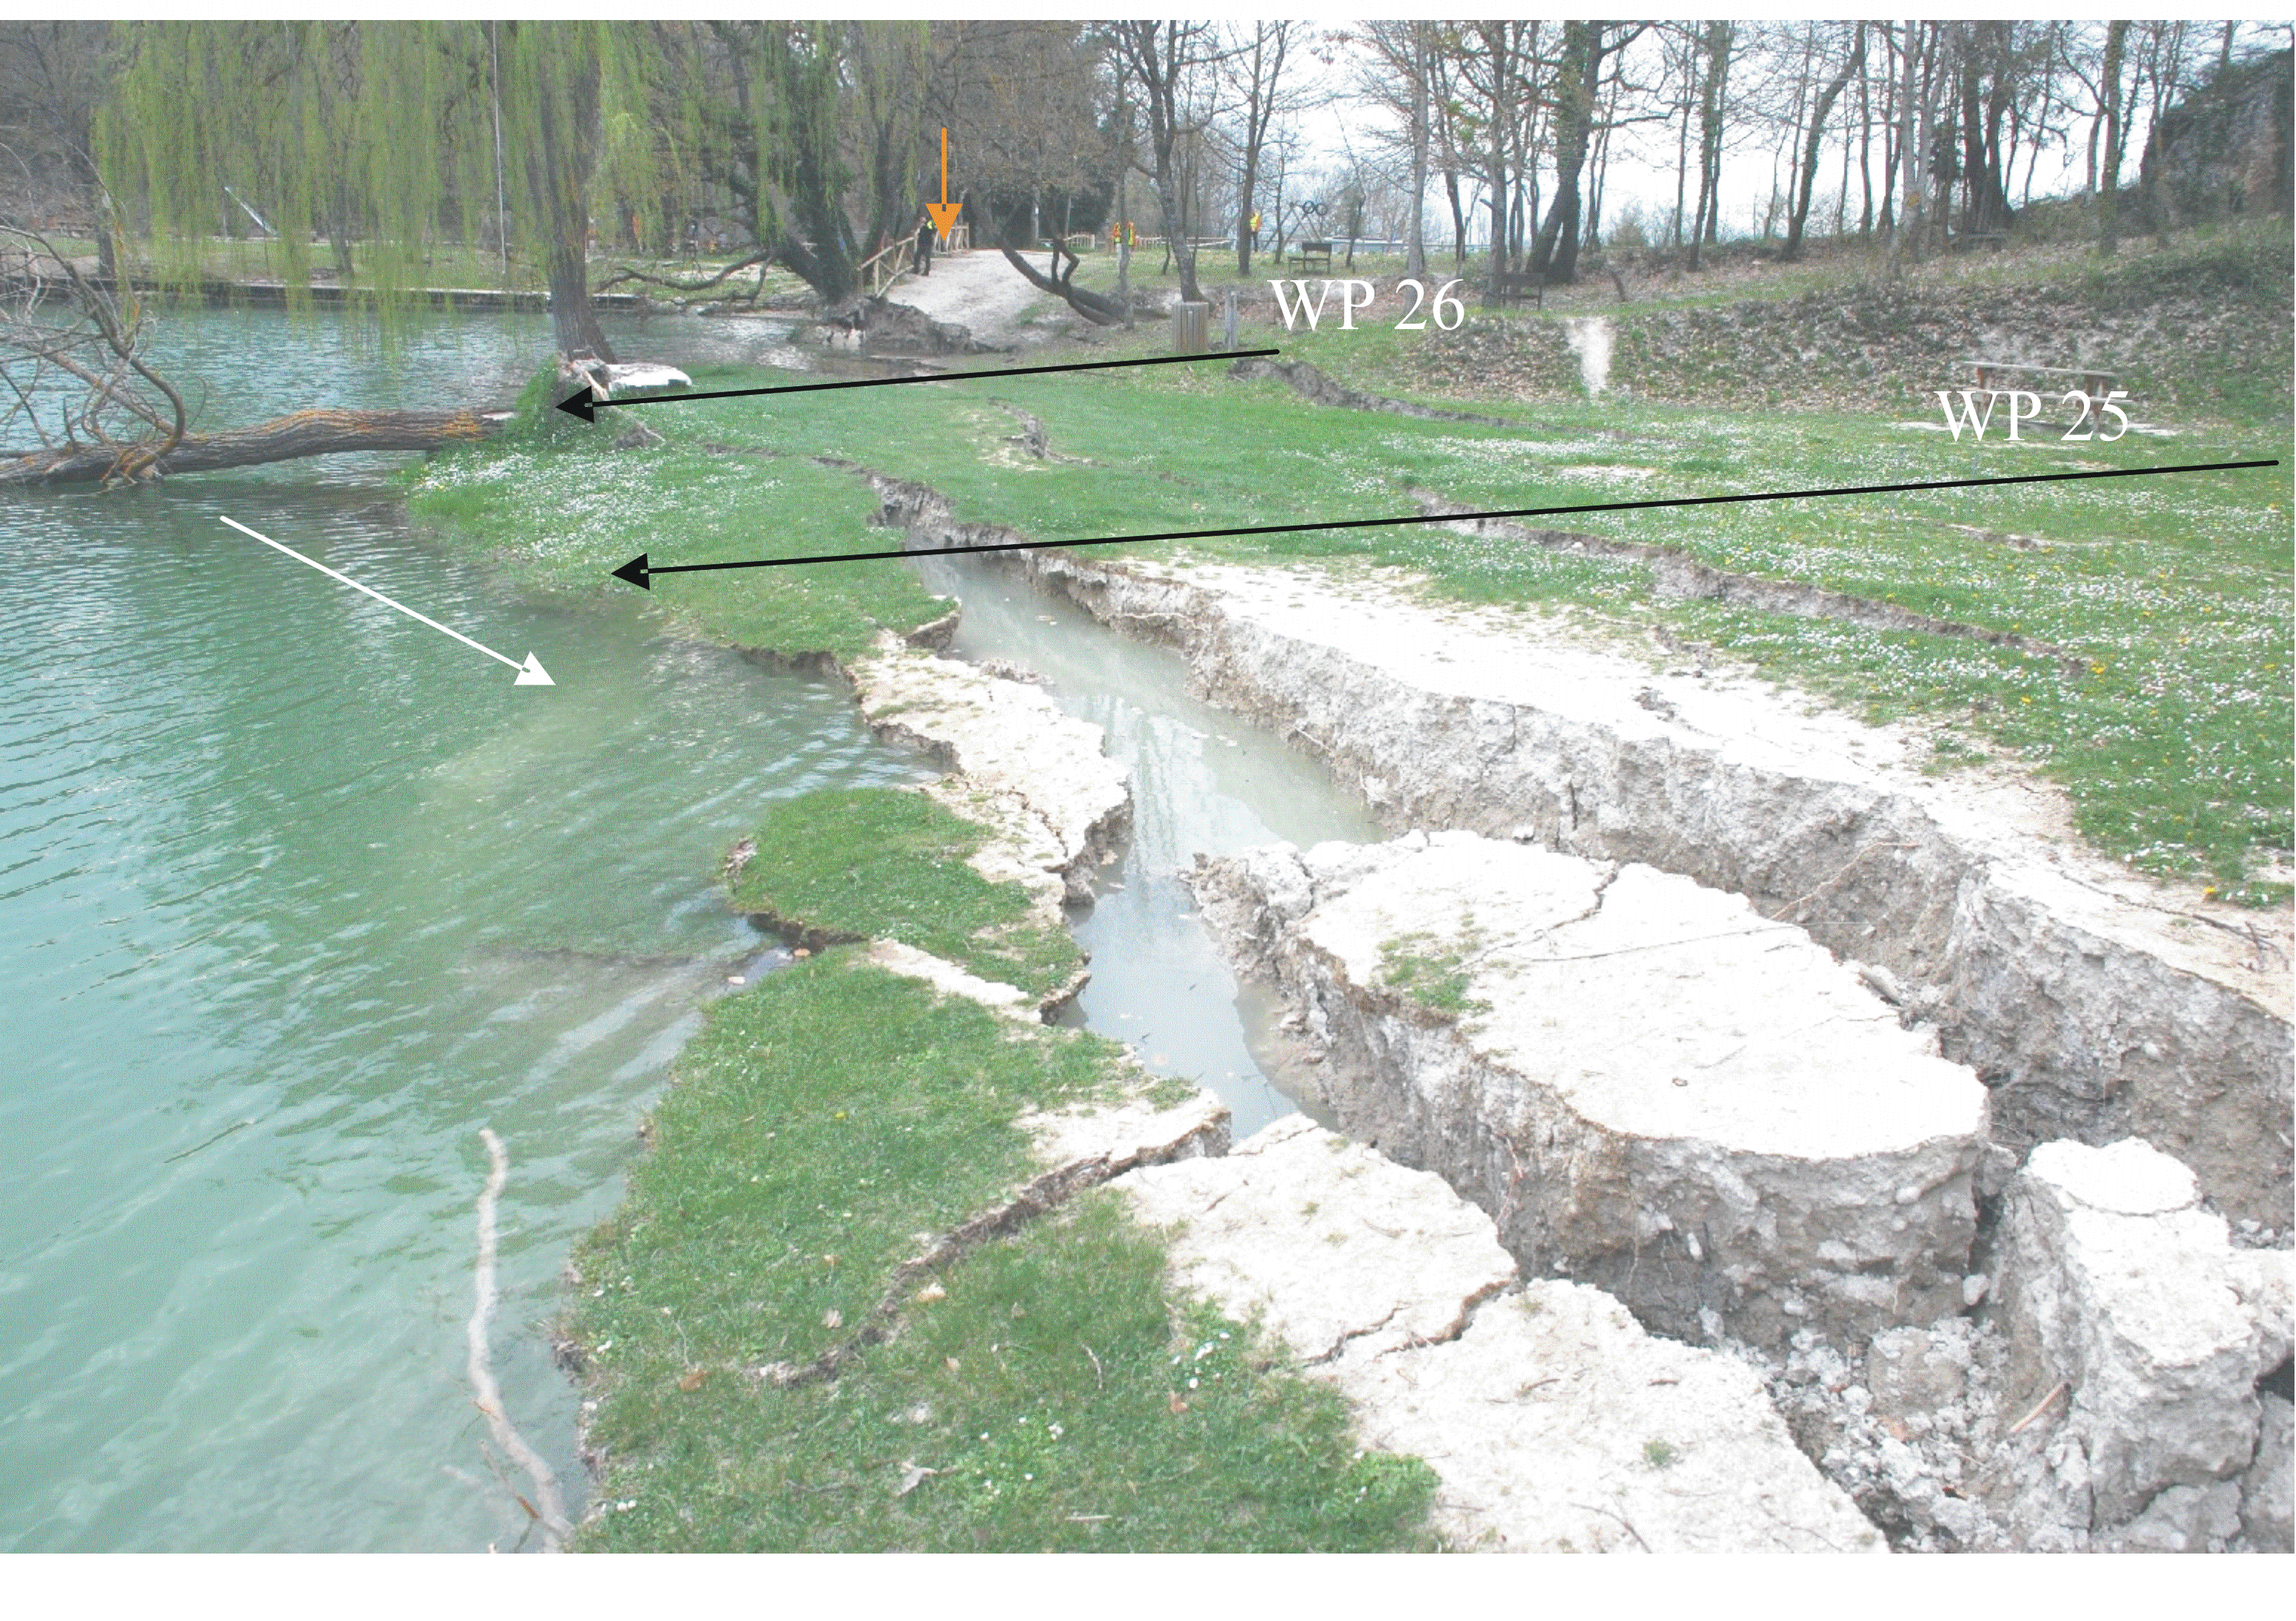
Figure 5.53. Blocks lying under the water (white arrow) were not included in the traverses (WP 25 and WP26). The orange arrow shows where the fence (and the slump below it) truncated the traverse at WP 27. (Photo E. Button).
Figure 5.52 plots the orientation and maximum cumulative crack opening distance for each measurement location superimposed on a Google Earth image of Lake Sinizzo. From this image it can be seen that the primary permanent displacements were towards the lake. However, the magnitude varies considerable with position around the lake.
Figure 5.54 summarizes the cumulative crack opening for all of the traverses at Lake Sinizzo. The largest permanent displacements occurred on the north and south shores respectively. The traverses at WP 25 and WP 26 document two locations associated with the largest permanent displacements at Lake Sinizzo with cumulative extension of more than 1 m. The traverses at WP 22 document three locations along the largest scarp observed on the south shore. Additional details on individual sections are given in the appendix.
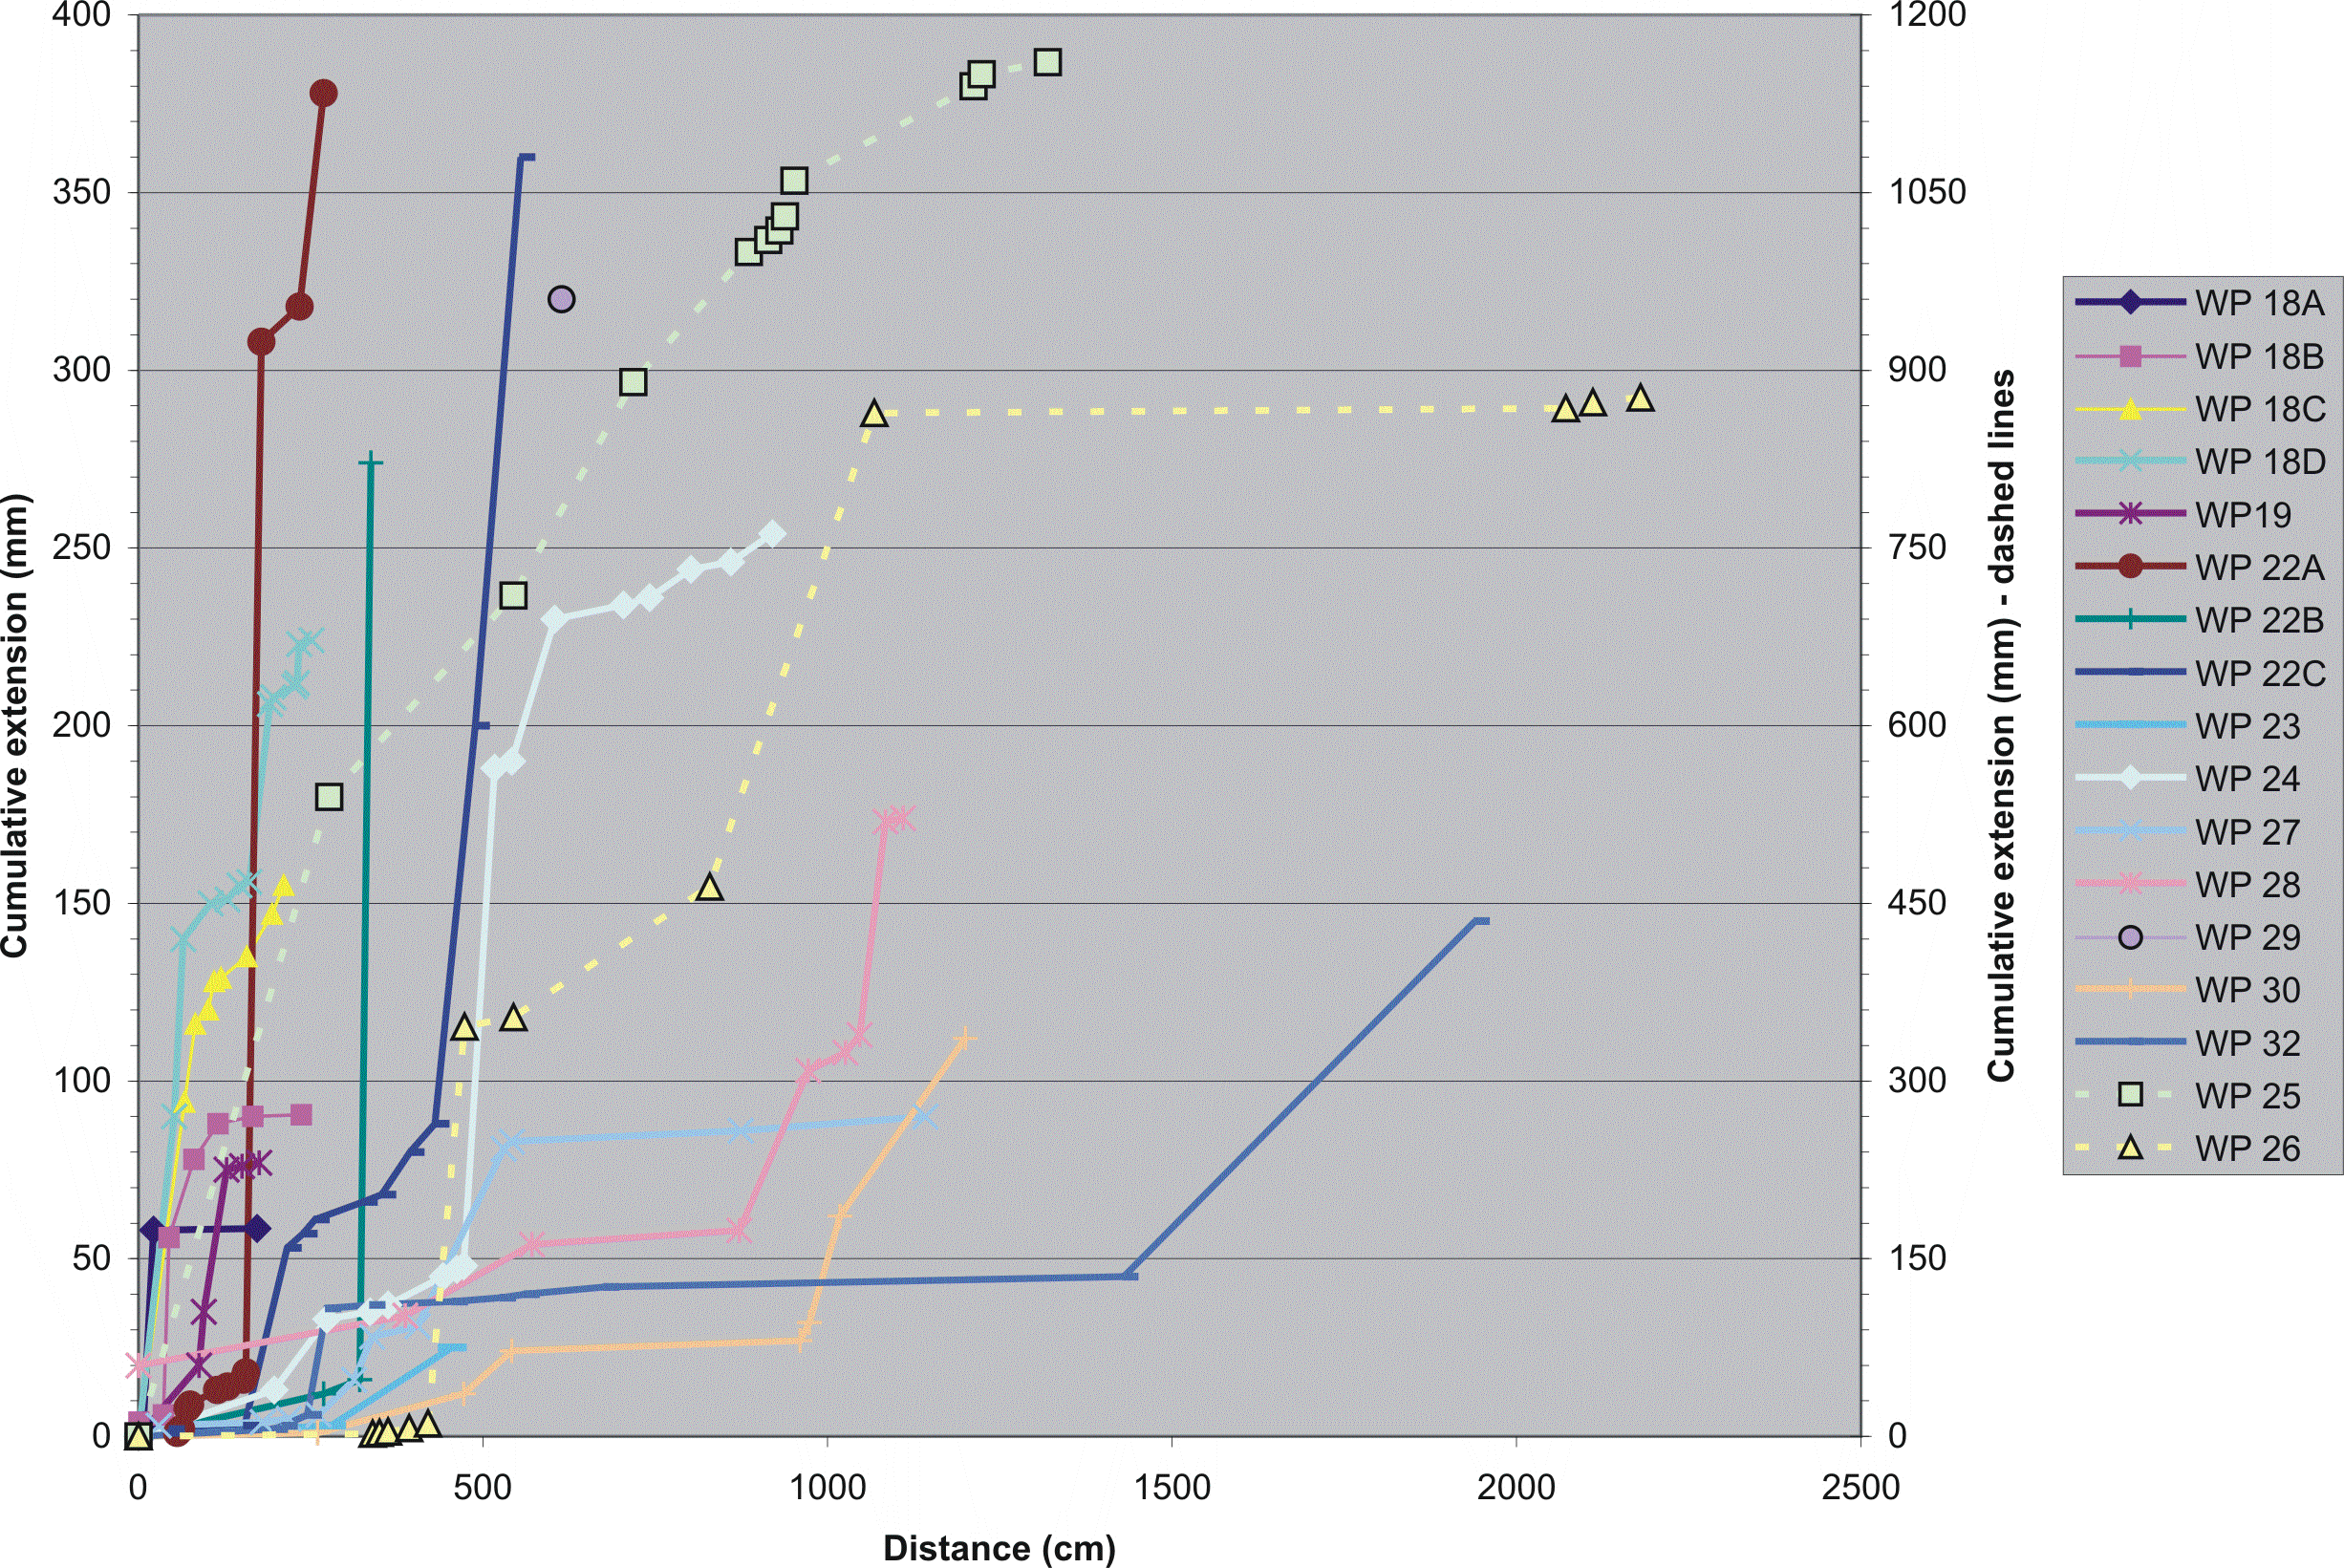
Figure 5.54. Plot of the cumulative crack opening (extension) for all of the measurement locations. The data for WP 25 and WP 26 are plotted relative to the right axis (3X larger).
The measurements at WP 31 were associated with differential displacements occurring at a park bench bedded into the ground. Figure 5.55 shows a schematic diagram of the bench and the associated displacements. The features related to the bench displacement for C2 and C3 corners are shown in Figure 5.56.
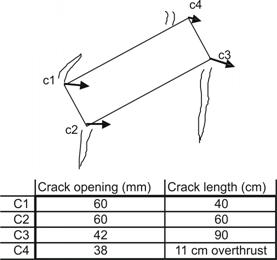
Figure 5.55. Schematic diagram and magnitudes of the cracks associated with the park bench at WP 31.
a. 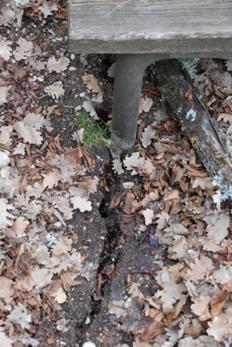 b.
b. 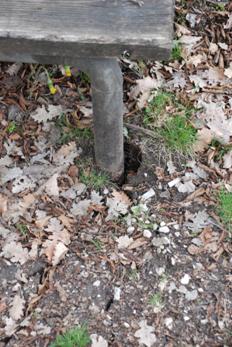
Figure 5.56. Characteristic deformations associated with the corners of the park bench at WP 31. (a) corner C2 and (b) corner C3
In summary, the extensional displacements associated with permanent ground displacements at Lake Sinizzo ranged from several mm to over 1 m depending on the location around the lake. Extensional cracks could be documented at distances of more than 20 m from the shore in the relatively flat terrain on the north shore. On the south shore extensional cracks were observed up to a distance of approximately 20 m, the cracks furthest from the shore were located on a hill slope extending towards the south. While the bedrock is very shallow in this location (southeast corner of the lake), adjacent outcrops of limestone 2-3 m away showed no signs of continuous cracking along the strike of ground cracks. This could indicate that the deformations were constrained to be within the Quaternary cover materials. At approximately the same elevation on the southwest corner of the lake weathered, friable marl bedrock stone was observed at a local slope failure. Thus the bedrock changes laterally along the southern shoreline and the potential for movements in the weathered bedrock cannot be excluded. The permanent displacements along the east shore of the lake were characterized by sub-parallel to anastomosing crack arrays with extensional displacements observable up to 9 m from the shoreline. The deformations along the east to southeast side of the lake were typically characterized by single slumps several of which slid into the lake (as shown in the post earthquake bathymetry) and only the scarps were visible. The furthest cracks were observed to be up to 12 m from the shore. The cracks with the largest opening distance were typically located between less than 10 m from the shore.
5.4.3 LIDAR imaging of above-water terrain
a. Procedures and equipment
During the earthquake reconnaissance, we deployed lidar technology to image the ground-failures along the margins of Lake Sinizzo. At the Lake Sinizzo site, the terrestrial lidar laser beam systematically scanned over the shore margin to acquire the precise distances to objects. The laser repeatedly shot pulses of light at each rotation point of the scanner, sending light to reflect off an object and back to the scanner. Timing the two-way travel time of flight of each laser pulse allows for the determination of the range. A spherical coordinate system is initially used to map the targets, and then data are converted to a Cartesian scanner coordinate system centered on a scanner instrument datum. Terrestrial LIDAR technology was used at Lake Sinizzo because of its ability for characterizing ultra-fine scale changes in topography (Collins and Sitar, 2006; Collins et al. 2009; Kayen and Collins, 2005; Kayen et al., 2006, Kayen et al., 2007; Stewart et al. 2009). LIDAR technology is a natural extension of laser range finder systems or electronic distance meters (EDMs) commonly used in survey applications to measure distances.
The USGS LIDAR system used at Lake Sinizzo is manufactured by Riegl of Austria and is based on a near-infrared YAG 1064nm laser transceiver. The system, a Riegl z420i unit, is portable and designed for the rapid acquisition of high-resolution three-dimensional imagery. The maximum target range is about 1000m for the Riegl under the best atmospheric conditions and is dependent on the reflectivity of the given target. For the Lake Sinizzo study, we operated at much shorter distances than the maximum range of the units. The minimum target distance is 2 m, the distance to the ground from a tripod-mounted system. The range accuracy is consistently about 4 mm for the Riegl at the range of interest in the study. The laser beam divergence angle is 3 milli-radians, meaning that at a range of 10 m, the beam footprint is approximately 30 mm across. Because of the footprint size, the shots are ideally spaced 3 milli-radians apart. The position of the center of the footprint is measured to a precision of 0.17 milli-radians by an encoder. The angular position of the laser-pulse leaving the scanner is controlled by precise servo-motors within the unit.
The USGS scanner (Figure 5.57) has a single scan sweep of 360deg horizontally, and 80deg vertically. The scanner takes several hundred thousand-to-several million individual x, y, z position measurements, at a rate of 12,000 points/second.
A tripod was used on the ground to deploy the instrument. The laser unit weighs 15 kg plus the weight of accessory cables, tripod, battery and laptop.

Figure 5.57. Deployment of the tripod-mounted Lidar system on the lake margin. The laser unit is connected to a laptop, battery, and photogrammetric camera.
3-D laser scanners cannot image behind objects, and the first object encountered casts a shadow over objects behind it. At low grazing-angles away from the scanner, the laser path angle decreases to only several degrees and proportionally larger shadows are cast on the ground behind the target. Also, at incident angles of less than approximately 4deg on relatively flat surfaces, often, the laser cannot detect any backscattered signal. To minimize shadow zones and get full coverage of the target surface, the scanner was elevated as much as possible. The sensor was moved around the lake for 10 individual setups to capture data from various orientations around the lake margin to image the shadow-forming targets of the ground failures. Manipulation of that data is performed with specialized surface modeling software and a portable graphics workstation. We utilize two surface modeling software packages, I-SiTE Studio (I-Site Pty. Ltd) and RiSCAN Pro (Riegl Co.). These software packages collect the scan point-cloud data and can process multiple scans into geo-referenced surfaces.
b. Lake Sinizzo Data Collection
Ten scans were collected around the perimeter of the lake on April 15, 2009. The locations of the scans were irregular, with a higher density along portions of the lake margin that failed. Figure 5.58 shows a composite registered image of the 10 scans for the entire lake margin alongside the Google Earth image of the lake. Figure 5.59 shows high-resolution detail of the lake point cloud. The Google Earth image of Figure 5.58a was taken prior to the earthquake. The black central portion of the lidar image in Figures 5.58b and 5.59 is the surface of the lake water. The near infrared laser is unable to penetrate water, and therefore, all portions of the lake that are submerged are un-imaged. The images are colored from red to blue in a rainbow shade, with the red being the lowest typography and blue the highest topography. The point cloud data does not have vegetation removed through filtering and individual trees can be seen overhanging the lake water. On the left side of the image a clump of trees can be seen in the water, and are the vegetation of the displaced landslide blocked that entered the lake.
We did not use differential GPS to register the lidar imagery. The Google Earth image in Figure 5.58a is oriented with true north up, whereas true north in the lidar image is slightly N-NE. During the data collection, we tried to orient the scanner using a non-differential GPS unit. The individual scans were registered by finding the least squares best fit solution between point clouds of the surrounding scans. As such, the data are registered in a project coordinate system to an accuracy of approximately 5 cm. This allows us to make accurate estimation of the ground information that occurred around the perimeter of the lake, but does not allow for us to project the image as a map without the additional effort to link the imagery to a geodetic and geographic datum.
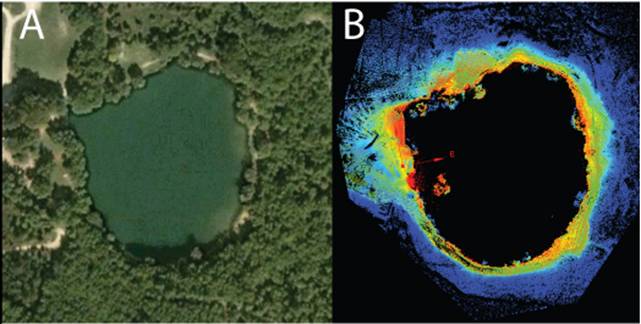
Figure 5.58. (a) Google Earth image of the lake taken prior to the earthquake, and (b) lidar point cloud image of the lake taken on April 15, 2009. The coloring in the lidar imagery ranges from red (lowest typography) to blue (highest typography).
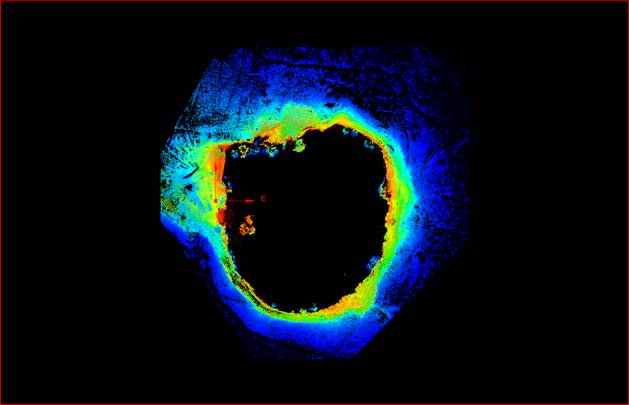
Figure 5.59. High-resolution detail of the lidar point cloud image of the lake taken on April 15, 2009.
Figure 5.60 shows oblique detail of ground failures along the lake margin, and overlapping imagery from three scans colored in red, purple, and green. Taking scans from different orientations allows for shadow zones to be filled. For example the central black circle in the image just above the "Z" axis is where the laser was set up during the capture of the purple data set. Subsequent scans, falsely colored, here as red and green, fill in the data hole beneath the scanner. In this image, areas can be seen where shadows cast by vegetation in one scan are filled by point cloud data from another scan. Fissures associated with lake margin soil sliding in toward the lake can be clearly seen in the green and purple scans. These features can be used to identify individual sliding blocks, and allow for reconstruction of pre-failure lake geometry needed to estimate ground deformation estimates, work that we are currently performing.

Figure 5.60. Detail of ground failure along the perimeter of Lake Sinizzo, captured in three of the overlapping scans (red, purple, and green).
5.4.4 Lake bathymetry
High resolution multibeam bathymetry of Lake Sinizzio was performed by Violante (2009) on May 8 2009 (32 days following the mainshock) as part of the GEER investigation. Details on the equipment used and methodology are given by Violante (2009).
Multi-beam bathymetric data were collected from a rubber boat equipped with a dedicated pole and flange used to operate the sonar head (Figure 5.61). Vessel tracks were positioned so as to insonify 100% of the lake floor with a high percentage of overlap (Figure 5.62). The processed data were used to generate a digital elevation model (DEM) with cell size of 5x5 cm, with an accuracy meeting the requirements of the International Hydrographic Organization (IHO).

Figure 5.61. Rubber boat equipped with the 8101 multibeam system.
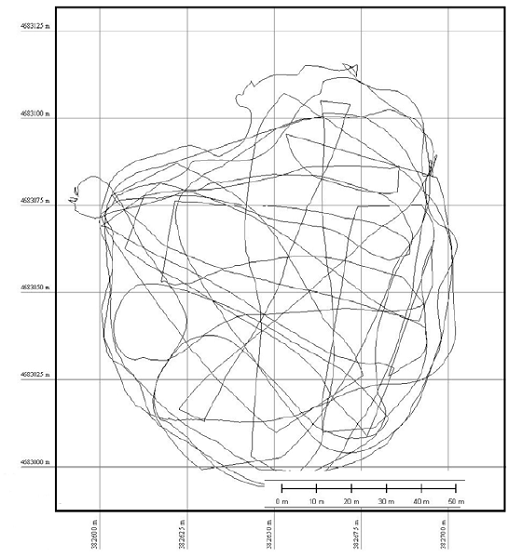
Figure 5.62. Navigational plan for the Lake Sinizzo bathymetric survey.
Figures 5.63 and 5.64 illustrate the main morphological features of the lake floor. Comparing the results to the 1984 single-beam bathymetry (Figure 5.46) indicates no significant differences in the general lake-floor configuration and relative depth distribution. The most relevant feature is an incipient instability denoted by an irregular morphological step (1 to 20/25 cm high) possibly locally evolving into a crack with an overall concave shape in plan-view, developing for about 120 m along the eastern side of the lake between -1.5 and -7.5 m. Some of these features may be underwater continuations of the cracks observed at lake banks. The western side of the lake seems to be affected by a shallow creep or decortication of the sediment cover. Also the multibeam data clearly show the area of detachment and accumulation of the "fallen trees" (Figure 5.49). The sliding block induced deformation of the lacustrine sediments during transportation towards the lake bottom.

Figure 5.63. Lake Sinizzo bathymetric survey results including cross sections.

Figure 5.64. Lake Sinizzo bathymetric survey results marked with interpretive symbols.