|
|
Seismological Setting
The hypocenter for the earthquake was preliminarily located at N47.1525° and W122.7197° at a depth of 52.4 km. The earthquake is estimated at a moment magnitude (Mw) of 6.8. The preliminary mechanism for this earthquake is tensional (normal) faulting in the subducting (downgoing) Juan de Fuca Plate, caused by bending of the plate. Figure 1 illustrates a preliminary moment tensor solution from the UC Berkeley Seismological Laboratory. The fault plane has a strike of 357° and a dip of 69°. Rupture propagated approximately 8 km south and 14 km north of the hypocenter. The dip extent of the rupture is approximately 16 km, thus the approximate fault area is 350 km2. Peak slip is approximately 3 m. Updated information can be obtained at http://www.seismo.berkeley.edu/seismo/
Figure 1. UC Berkeley Seismological Laboratory Moment Tensor Solution. |
|
Figure 2. Cross section of historical seismicity in Washington state. |
Preliminary reports indicate that a total of 56 free field motions were triggered by the event. This number is likely to change rapidly as new records are processed. Further revision may also result in removing some of the records due to instrument malfunctions. Figures 3 to 6 show contour plots of peak ground acceleration, peak ground velocity, and spectral acceleration at a period of 0.3 and 1.0 s. Updated maps can be seen at http://www.geophys.washington.edu
Figure 3. Contour map of PGA. (Figure by: Pacific Northwest Seismograph Network,PNSN http://www.geophys.washington.edu/SEIS/PNSN/welcome.html) |
Figure 4. Contour map of PGV. (Figure by: Pacific Northwest Seismograph Network,PNSN http://www.geophys.washington.edu/SEIS/PNSN/welcome.html) |
Figure 5. Contour map of spectral acceleration at T = 0.3 s. (Figure by: Pacific Northwest Seismograph Network,PNSN http://www.geophys.washington.edu/SEIS/PNSN/welcome.html) |
Figure 6. Contour map of spectral acceleration at T = 1.0 s. (Figure by: Pacific Northwest Seismograph Network,PNSN http://www.geophys.washington.edu/SEIS/PNSN/welcome.html) |
Figure 7. Comparison of recorded peak ground acceleration (PGA) with the attenuation relationship proposed by Youngs et al. (1997). The median and median plus and minus one standard deviation PGA values are given for rock and soil site classes, respectively. The closest distance to the fault plane is based on the fault plane solution developed by Dreger (2001) with a simplification for the dip of the fault. Distance is judged to be accurate to within 5 km. The site classifications were provided by Kathy Troost and Derek Booth of the University of Washington and are based on geologic maps. The classifications will require re-examination after more information becomes available. |
Figure 8. Significant Duration (duration from 5% to 95% of Normalized Arias Intensity). Duration estimates obtained from the University of Washington department of geophysics http://www.geophys.washington.edu. The closest distance to the fault plane is based on the fault plane solution developed by Dreger (2001) with a simplification for the dip of the fault. Distance is judged to be accurate to within 5 km. The site classifications were provided by Kathy Troost and Derek Booth of the University of Washington and are based on geologic maps. The classifications will require re-examination after more information becomes available. |
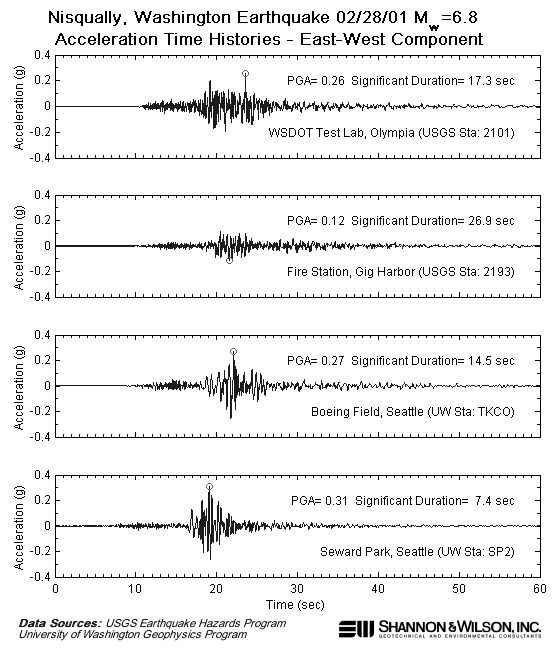
Figure 9. Time histories for the East-West component of selected stations. The approximate closest distance from the fault for these stations are 39 km for the USGS stations (WSDOT test lab and Gig Harbor Fire Stations), and about 56 km for the University of Washington stations (Boeing Field and Seward Park). (Courtesy of Robert Mitchell, Shannon and Wilson, Inc.). |