2.4 Source Characteristics
The distribution of aftershocks is shown in Figure 2.4. The aftershock pattern is aligned with the roughly northeast-southwest orientation of the Rokko fault zone and extends over a distance of about 45 km. The time sequence and orientation of faulting during the Kobe earthquake has been inferred from the analysis of strong motion data by Pitarka et al. (1995) and teleseismic data by Kikuchi (1995). The focal mechanism and fit of recorded and synthetic strong motion waveforms in the Pitarka et al (1995) model is shown in Figure 2.5, and the focal mechanism developed by Kikuchi (1995) is shown in Figure 2.6. Southwest of the epicenter, away from Kobe, the earthquake produced 11 km of surface rupture with an average horizontal displacement of 1 to 1.5 m on the Nojima fault, which runs along the northwest shore of Awaji Island. The surface faulting is described in further detail in the next section. The strike-slip motion was accompanied by a component of thrust motion, producing a fault scarp dipping to the southeast, with the northwest side down. This dip direction is consistent with the offset of the surface rupture by a few kilometers to the northwest from the epicenter, and with the focal mechanism of the first event as inferred by Kikuchi (1995) and Pitarka et al. (1995). The dip direction and the dip-slip motion is reversed on the part of the rupture that extends to the northeast from the epicenter, toward Kobe. A releveling survey after the earthquake found a decrease in elevation of 26 cm between Tarumi and Suma Wards in western Kobe. This change in elevation is inferred to mark the location of subsurface faulting. The dip-slip displacement to the southeast on a fault plane dipping northwest is seen in the focal mechanisms of later subevents in the rupture model of Pitarka et al. (1995) shown in Figure 2.5. Both the Kikuchi and Pitarka et al. rupture models indicate that the propagation of the rupture toward Kobe involved several subevents distributed along the fault at depths of 6 to 8 km. Pitarka's model has uniform strike but variations in dip and rake among four subevents, while Kikuchi's model has variations in strike as well as variations in rake of three subevents. From the fault geometry (30-50 km long x 15 km wide), the average slip is 1.1 to 1.9 m and the stress drop is 14 to 24 bars (Kanamori, 1995).
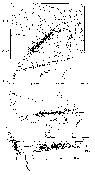 Figure 2.4: Locations of aftershocks for the period from January 17 to January 20, 1995 (JST) located using the data from the micro-earthquake network of Kyoto, Tokyo and Nagoya universities. Source: Disaster Prevention Research Institute, Kyoto University.
 Figure 2.5: Focal mechanism and source process of the Kobe earthquake by Pitarka et al. (1995). The earthquake consisted of four subevents, whose locations and focal mechanisms are shown at the top. Recorded (heavy lines) and synthetic (light lines) waveforms are compared at the bottom. Source: Pitarka et al. (1995).
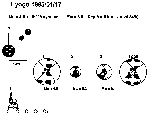 Figure 2.6: Focal mechanism and source process of the earthquake by Kikuchi (1995). The earthquake consisted of three subevents, whose relative locations are shown in the upper left, time functions in the lower left, and focal mechanisms and moment magnitudes to the right. The largest subevent was located at the hypocenter. Source: Kikuchi (1995).
 Figure 2.4: Locations of aftershocks for the period from January 17 to January 20, 1995 (JST) located using the data from the micro-earthquake network of Kyoto, Tokyo and Nagoya universities. Source: Disaster Prevention Research Institute, Kyoto University.
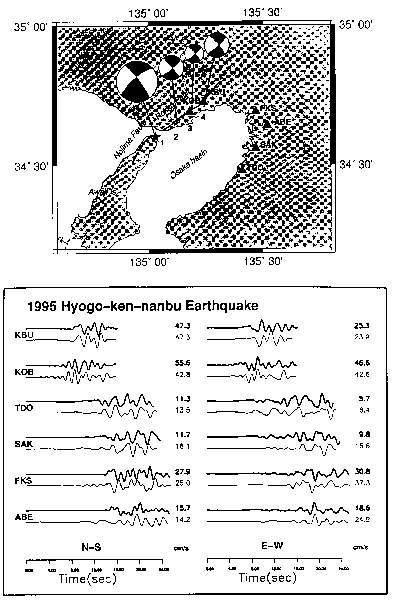 Figure 2.5: Focal mechanism and source process of the Kobe earthquake by Pitarka et al. (1995). The earthquake consisted of four subevents, whose locations and focal mechanisms are shown at the top. Recorded (heavy lines) and synthetic (light lines) waveforms are compared at the bottom. Source: Pitarka et al. (1995).
 Figure 2.6: Focal mechanism and source process of the earthquake by Kikuchi (1995). The earthquake consisted of three subevents, whose relative locations are shown in the upper left, time functions in the lower left, and focal mechanisms and moment magnitudes to the right. The largest subevent was located at the hypocenter. Source: Kikuchi (1995).