2.1 Seismological Aspects
The August 15, 2007 Pisco earthquake was the result of the subduction process between the Nazca plate and the South American continental plate. This subduction process results in a high rate of seismicity along the coasts of Peru and Chile. The 2007 earthquake was an interface event and occurred on a previously identified seismic gap between the rupture areas of the 1974 Lima and the 1996 Nazca earthquakes (Tavera and Bernal 2005). The 2007 Pisco Earthquake had a moment magnitude (Mw) of 8.0 (USGS, Harvard CMT). The hypocenter was located at 13.76S and 76.97W, at a depth of 39 km (USGS). Fault rupture propagated south from the hypocenter (Tavera et al. 2007). The finite fault solution of Ji and Zeng (2007) indicates a rupture plane with a strike of 324º and a dip of 27º, having approximate dimensions of 190 km along strike and 95 km along dip (Figure 2.1). The locations of aftershock hypocenters match this fault plane (Tavera et al. 2007). The shallow dip and large width of the fault plane implies that the cities most affected by the earthquake (i.e. Pisco and Ica) lie within the ground surface projection of the fault plane. The large duration of recorded ground motions (see Section 2.2) indicates a complex rupture process, with an approximate duration of 210 seconds (Tavera et al. 2007).
The Pisco Earthquake was recorded at 15 stations within 150 km of the fault plane (note that distances to the fault plane use the rupture plane obtained by Ji and Zeng 2007). The number of recording stations may increase as some institutions were still processing data at the time of this publication (Sept. 4, 2007). Table 2.1 lists the 15 recording stations along with relevant ground motion parameters. The locations of these stations are shown on a map in Figure 2.2. Note that all of the recording stations except for one (PCN) are located approximately 100 km to the north in the vicinity of Lima. A plot of PGA versus closest distance to the fault for all 15 ground motion stations is shown in Figure 2.3. For reference, the predictions of the Atkinson and Boore (2003) attenuation relationships for soil and rock are also shown. Observe that the only station in Ica (Parcona or PCN ) recorded a PGA of approximately 0.5g, which is higher than the 85th percentile prediction for the soil attenuation relationship of Atkinson and Boore, while the recording stations near Lima have PGA values in general that are lower than the 15th percentile prediction by the attenuation relationships. Site type at the ground motion stations was inferred from local zonation maps (Aguilar and Alva 2007) and from Tavera et al. (2007). A pattern of higher PGAs at soil stations is observed. For example, the two Sedapal stations (E1 and E2) are closely located and the PGA at the soil station (0.056g) is 2.6 times higher than that measure at the rock station (0.021g).
Additional evidence of site effects is seen by the distinctly different spectral shapes observed in the four CISMID stations (Figure 2.4), which are located in three different soil types. Site effects are manifested by significant amplification over period bands that are compatible with the general site description (i.e. shallow, stiff soil deposits at La Molina and soft soils at Callao).
Links to the recorded time histories for records which are available are given in Table 2.1. The records for the La Molina (stiff soil) and El Callao (soft soil) stations are also shown in Figures 2.5 and 2.6 below. Additional records can be accessed through Table 2.1. Observe that all records show two phases of strong ground motion, which correspond to slip along two asperities seen in the finite fault solution (Figure 2.1). A windowed Fourier transform of each of the two phases of motion is shown in Figure 2.7 for La Molina station. Observe that the second phase of motion is more intense across the entire spectrum, but low frequency (e.g. long period) energy is particularly enhanced in the second phase.
All the strong motion records had long durations of strong shaking. For example, for the La Molina record, the 5-95% significant duration (Trifunac and Brady 1975) is 101.3 seconds and the bracketed duration (duration of ground motion higher than 0.05g) is 98.6 seconds. A duration of approximately 100 seconds is significantly longer than the duration expected for earthquakes of similar magnitude from shallow crustal events (e.g. the attenuation relationships of Abrahamson and Silva 1996, developed using data from shallow crustal events, predicts a median duration of 48 s for a Mw 8.0 earthquake). Other ground motion parameters will be made available later as digital records become available.
References
Aguilar Bardales, Z., and Alva Hurtado, J. (2007). Seismic Microzonation of Lima. Presentation in International Conference of Earthquake Engineering, Centro Peruano Japonés de Investigaciones Sismicas y Mitigación de Desastres (CISMID), Universidad Nacional de Ingeniería, Lima, Peru. In Spanish. [CISMID Download site, works with IE]
Atkinson, G. M. and Boore, D. M. (2003). "Empirical Ground-Motion Relations for Subduction-Zone Earthquakes and Their Application to Cascadia and Other Regions." BSSA 93(4) 1703-1729.
Ji, Z. and Cheng, Y. (2007). Preliminary Result of the Aug 15, 2007 Mw 8.0 Coast of Central Peru Earthquake, Web report (http://earthquake.usgs.gov/eqcenter/eqinthenews/2007/us2007gbcv/finite_fault.php)
Lazares La Rosa, F., Almora, J.P., López Vásques, J., Cabrejos Hurtado, J.J., and Piedra Rubio, R. (2007). "Analysis of accelerograms, Ica earthquake of August 15, 2007." Presentation in International Conference of Earthquake Engineering, Centro Peruano Japonés de Investigaciones Sismicas y Mitigación de Desastres (CISMID), Universidad Nacional de Ingeniería, Lima, Peru. In Spanish. [CISMID Download site, works with IE]
Tavera, H., and Bernal, I. (2005). "Spatial distribution of rupture areas and seismic gaps in the western coast of Peru." Volumen Especial No.6 Alberto Giesecke Matto, p. 89-102, in Spanish.
Tavera, H., Bernal, I., and Salas, H. (2007). "The August 15, 2007 (7.9Mw) Pisco Earthquake, Ica Department - Peru (Preliminary Report)." Boletín Sociedad Geológica, Instituto Geofísico del Perú, August 2007, in Spanish.
Trifunac, M.D., and Brady, A.G. (1975). "A study of the duration of strong earthquake ground motion." BSSA 66(4), 139-162.
| Table 2.1 Ground motion stations that recorded the 2007 Pisco Earthquake. The PGA values reported in this table were obtained from Tavera et al. (2007). Click on each station name to see time histories (for those that are available) | |
 |
Figure 2.1 Finite fault solution by Ji and Zeng (2007). Location of main cities is only approximate.
|
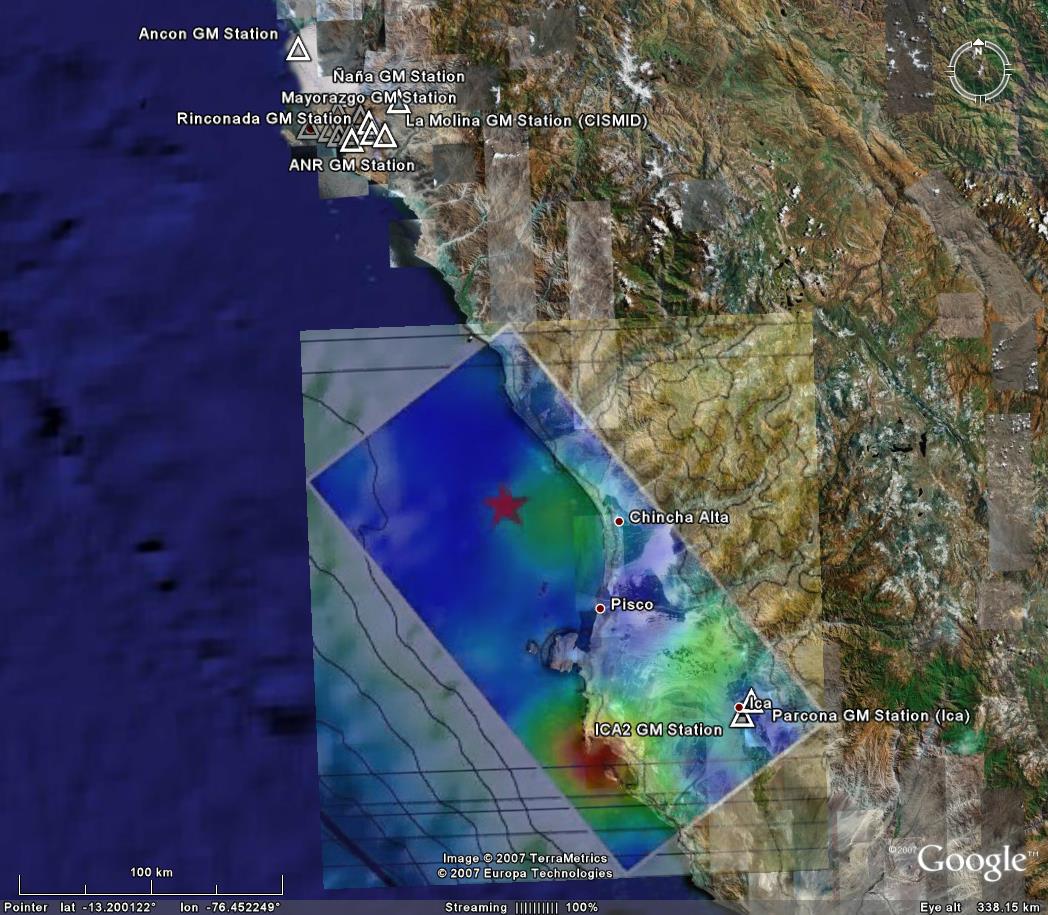 |
Figure 2.2 Location of ground motion stations (indicated by triangles). The image overlay shows the finite fault solution of Ji and Zeng (2007). The group of ground motion stations in the north of the figure is located in the city of Lima (Background image from Google Earth).
|
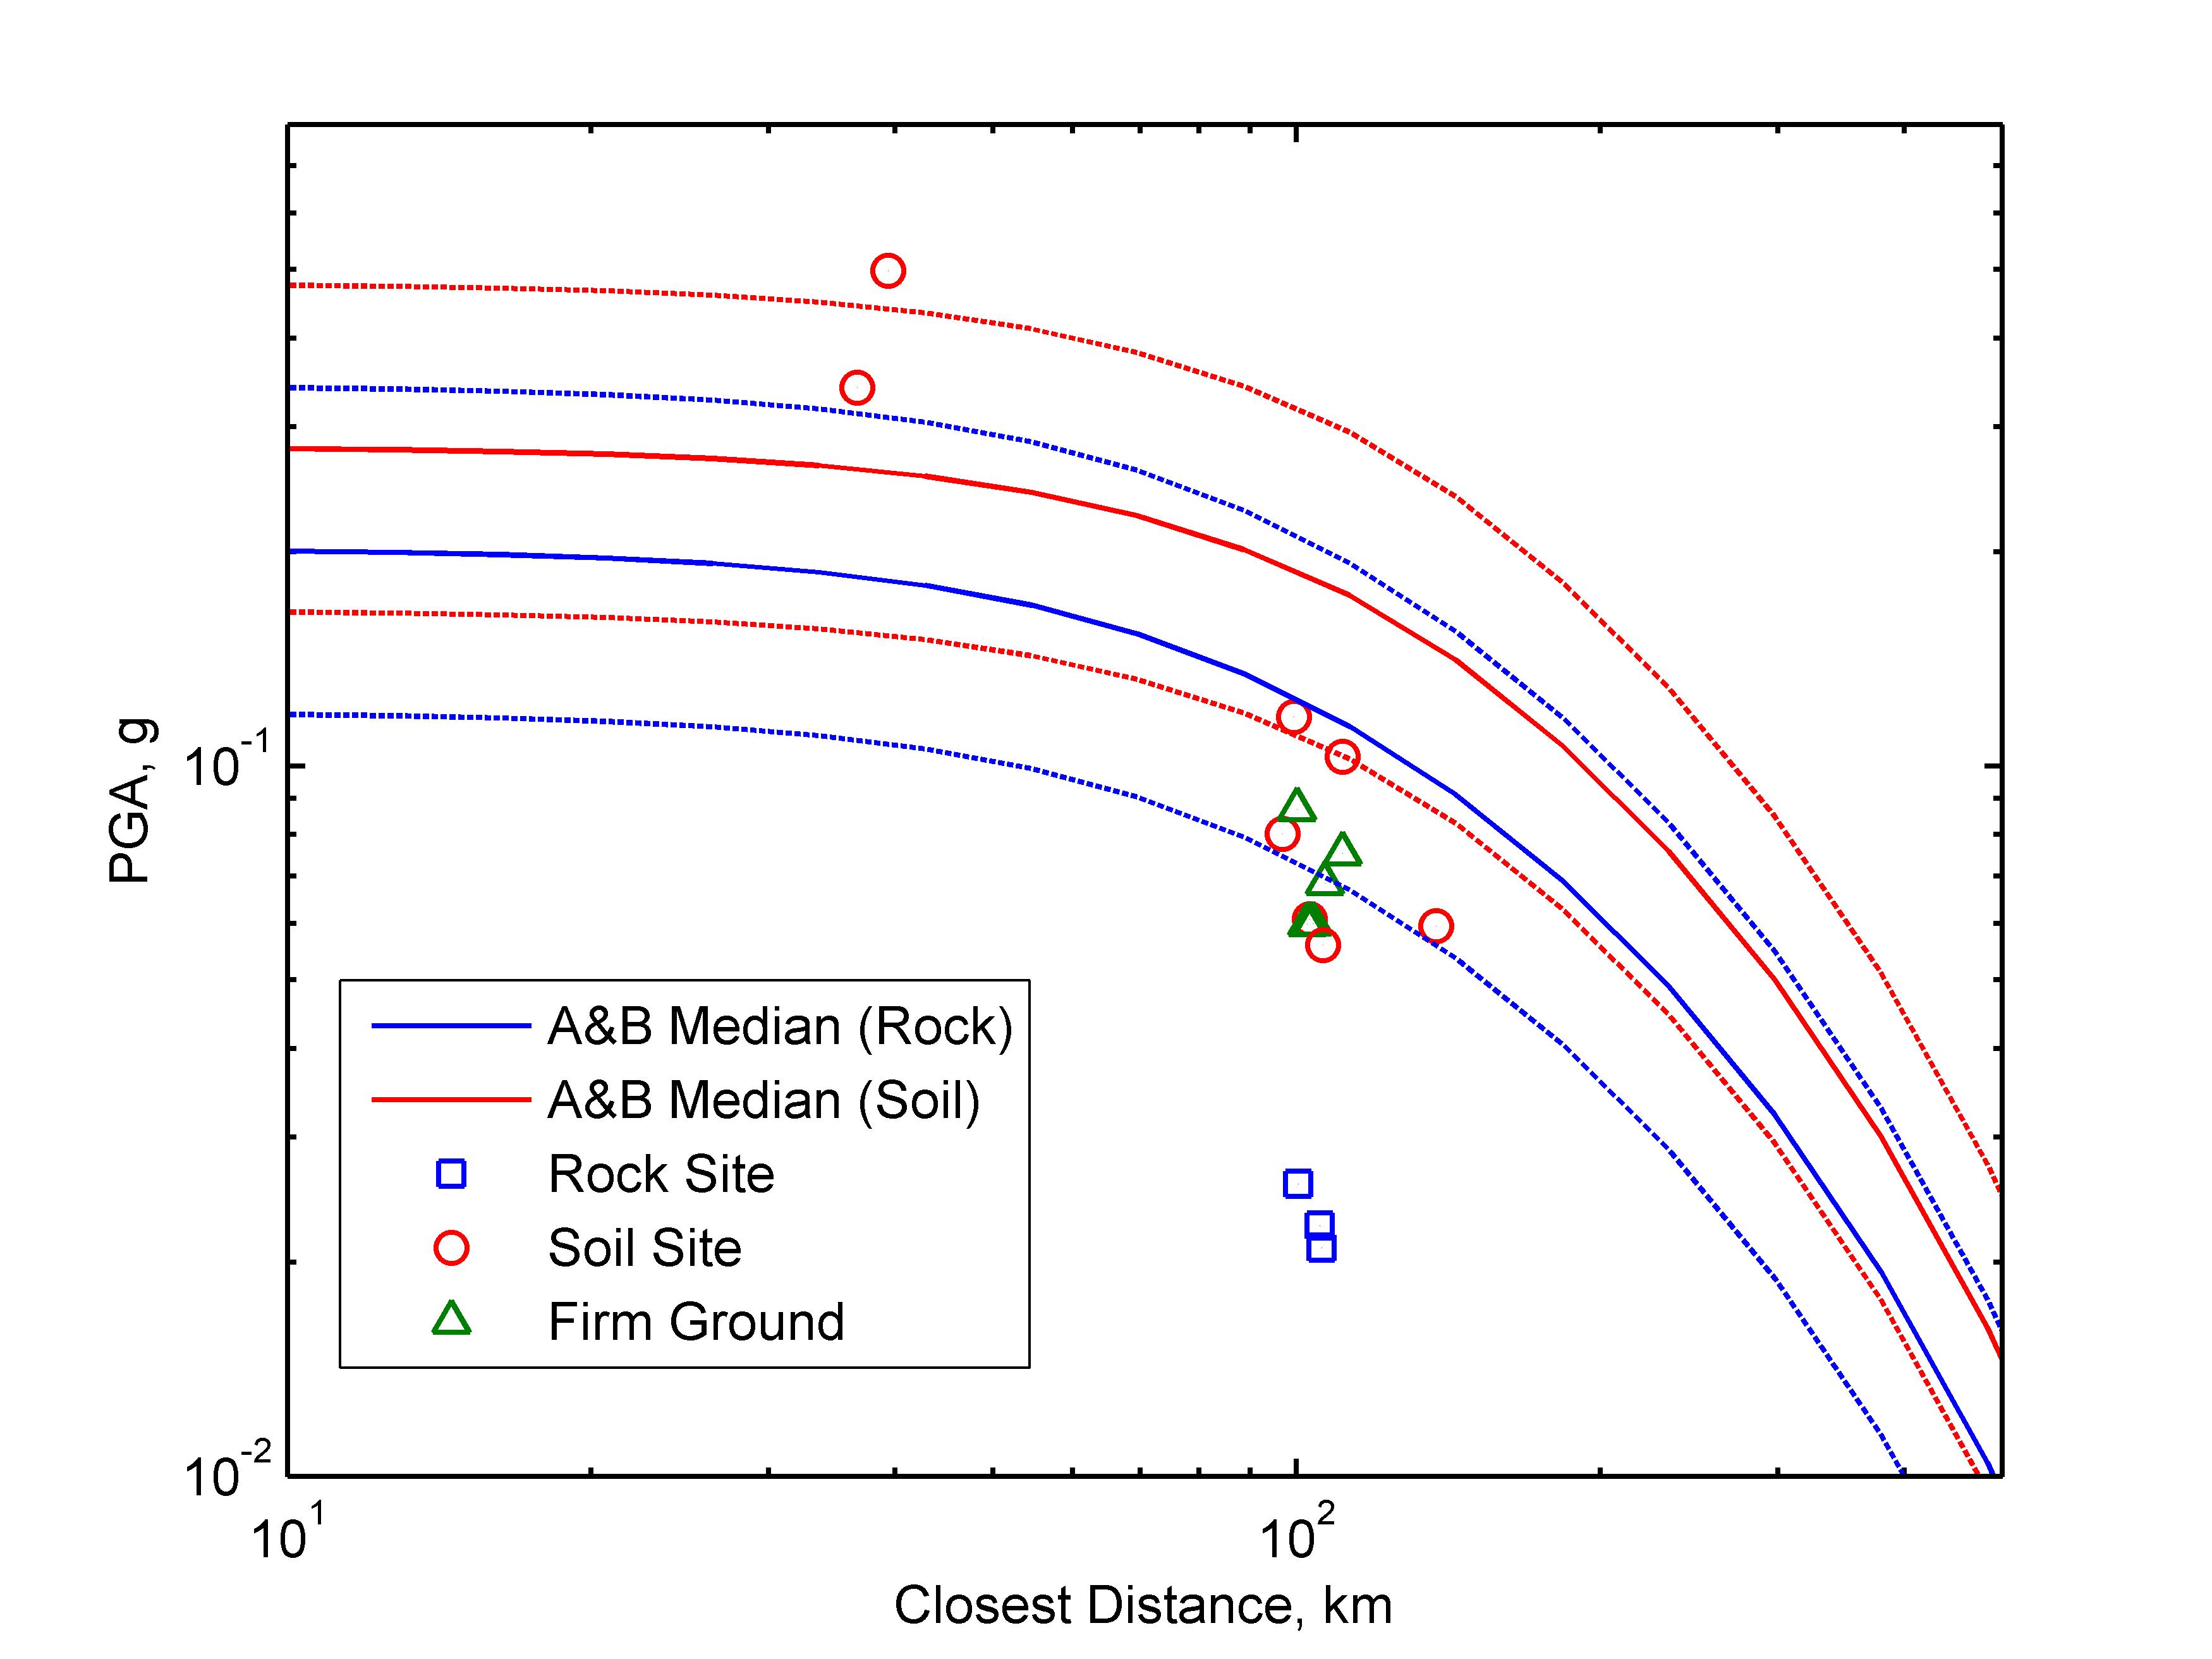 |
Figure 2.3 Recorded peak ground acceleration (maximum of EW and NS component) versus closest distance to the fault plane. Closest distance is measured from the finite fault solution of Ji and Zeng (2007). The predictions of the Atkinson and Boore (2003) attenuation relationship (median prediction with one standard deviation band) are shown for reference. Site type at the ground motion stations was inferred from local zonation maps (Aguilar and Alva 2007) and from Tavera et al. (2007), and can only be considered an estimation. Firm Ground station are those located in a dense, stiff, slightly cemented gravel deposit locally known as "Lima Conglomerate" or "Cascajo." |
 |
Figure 2.4. Spectral accelerations recorded by CISMID stations . All stations are located at a range of 96 to 111 km from the fault plane. The Rimac and San Isidro stations are located on dense, very stiff gravel deposits (locally referred to as Lima Conglomerate); the La Molina station is located on shallow soil overlying the denser Lima Conglomerate, while the Callao station is located on soft soil. |
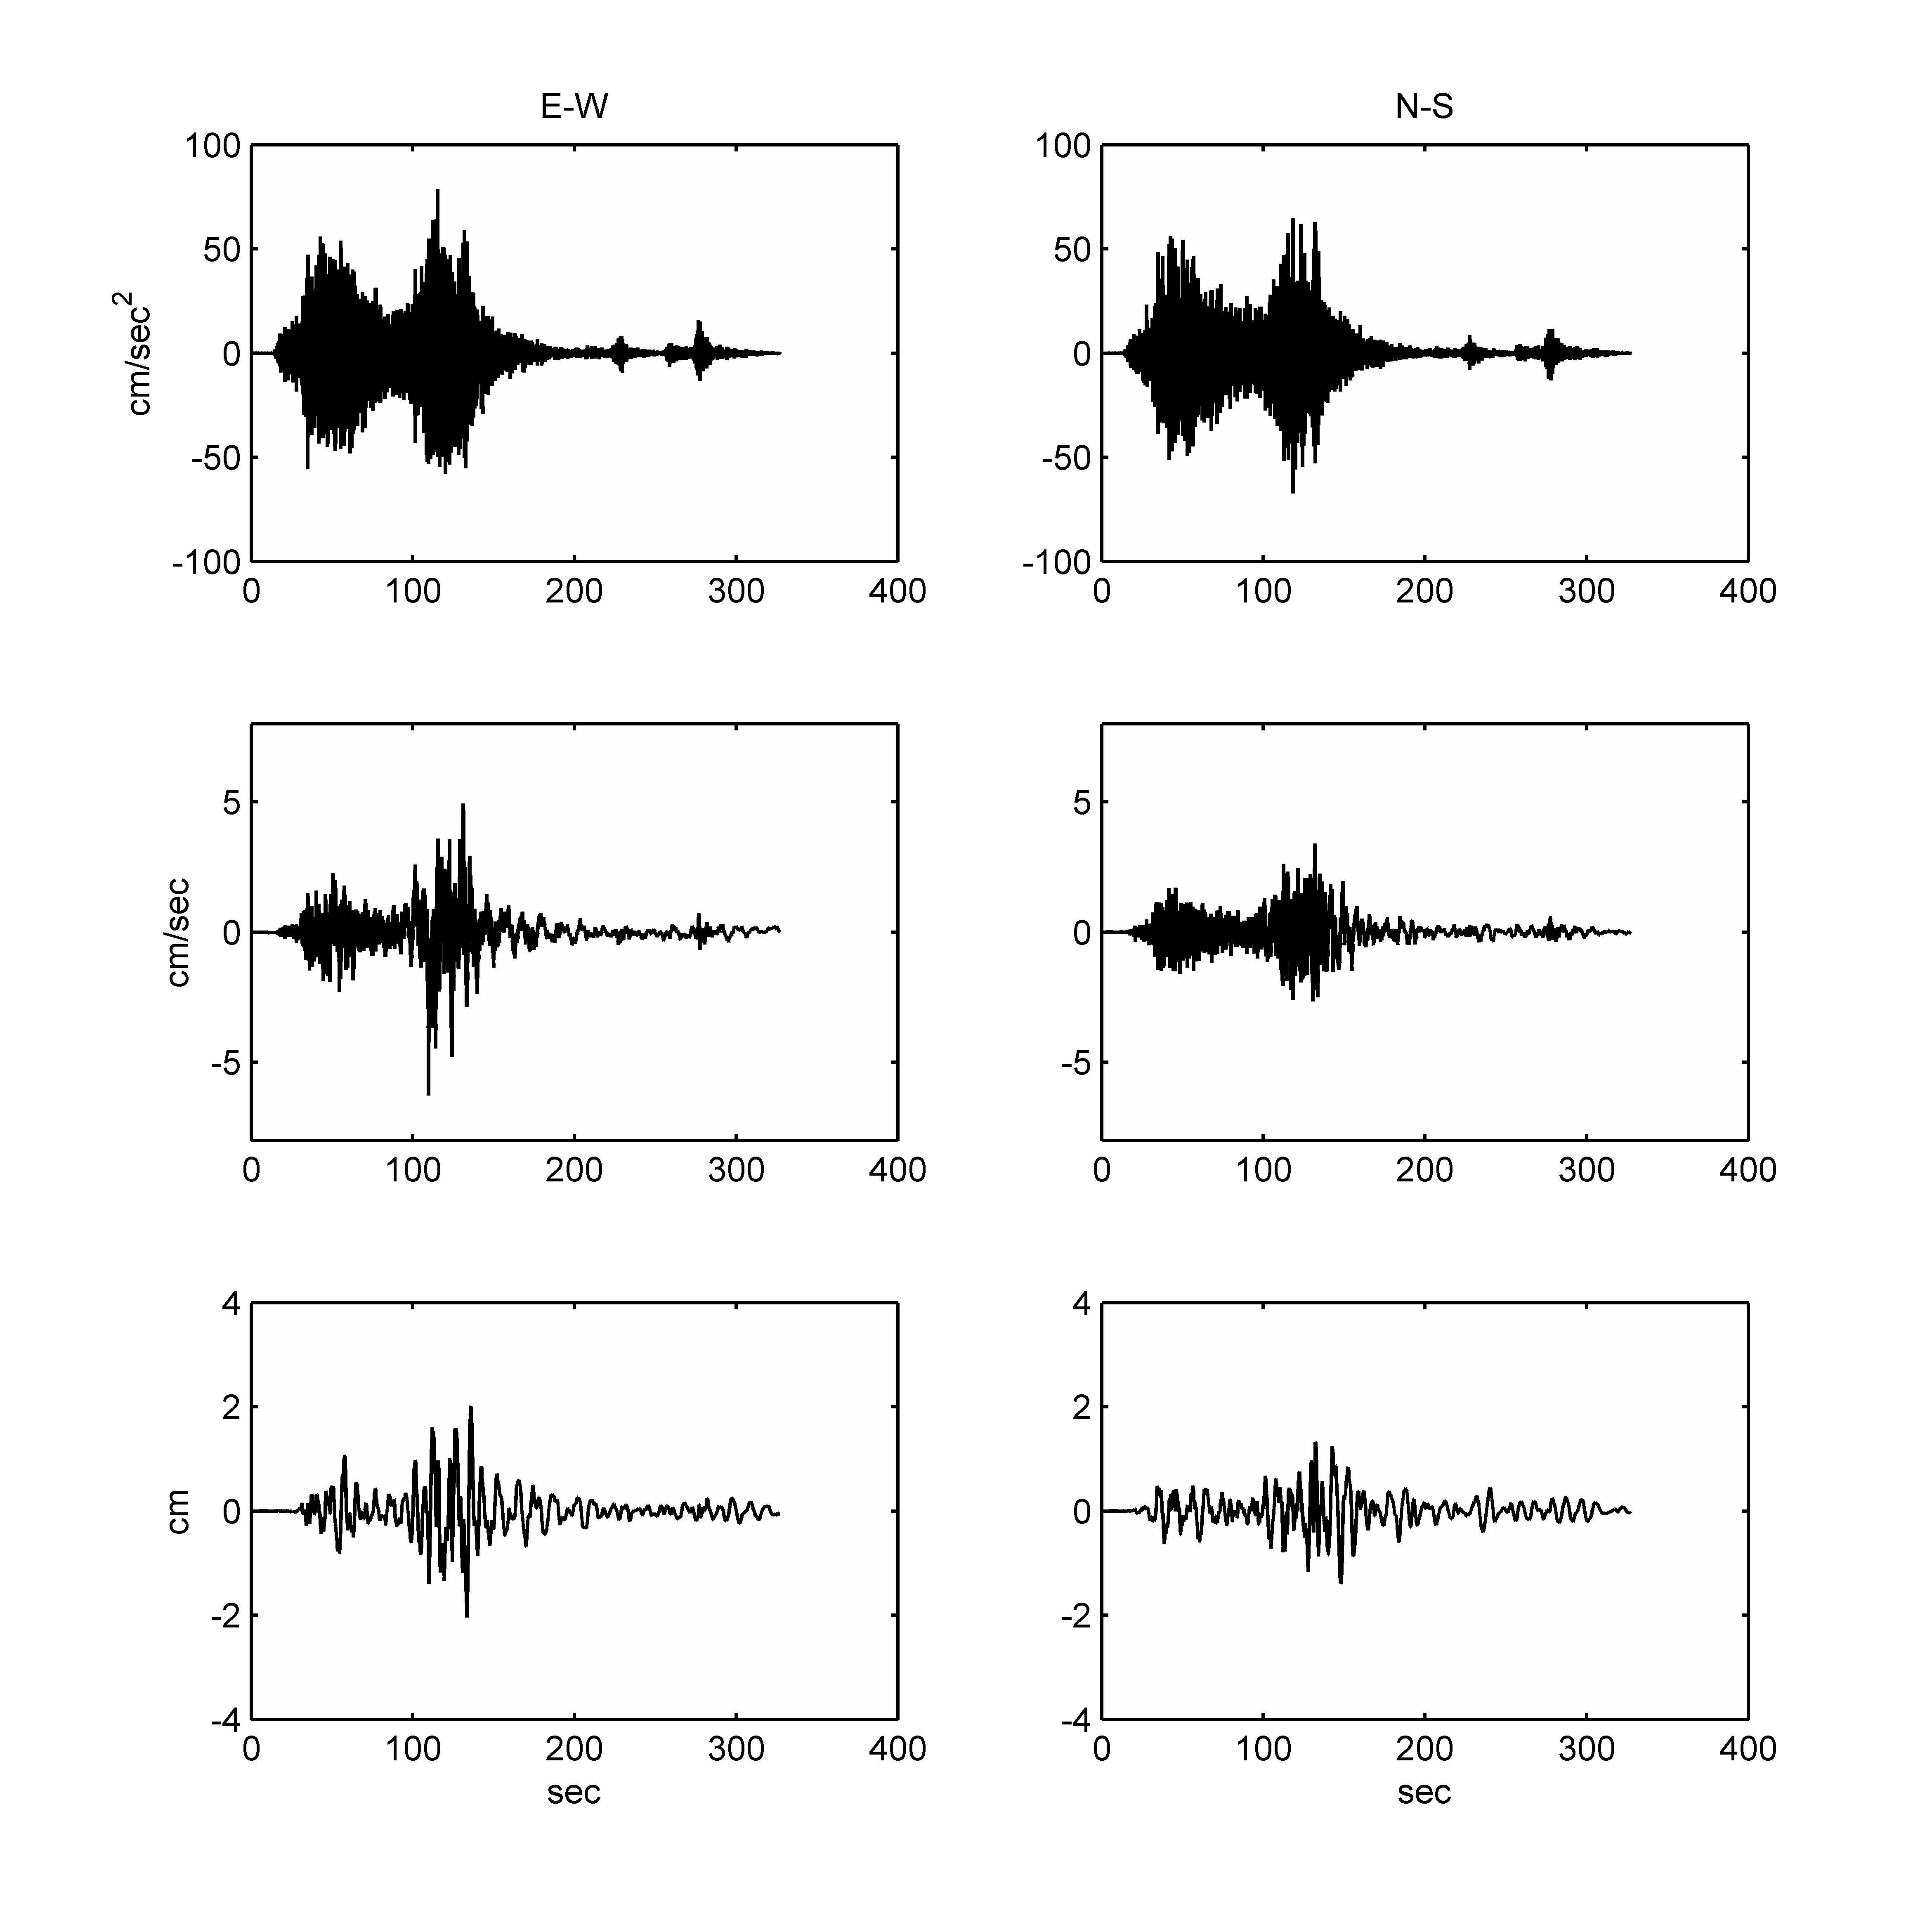 |
Figure 2.5: Acceleration, velocity, and displacement time histories for the La Molina record (stiff soil). |
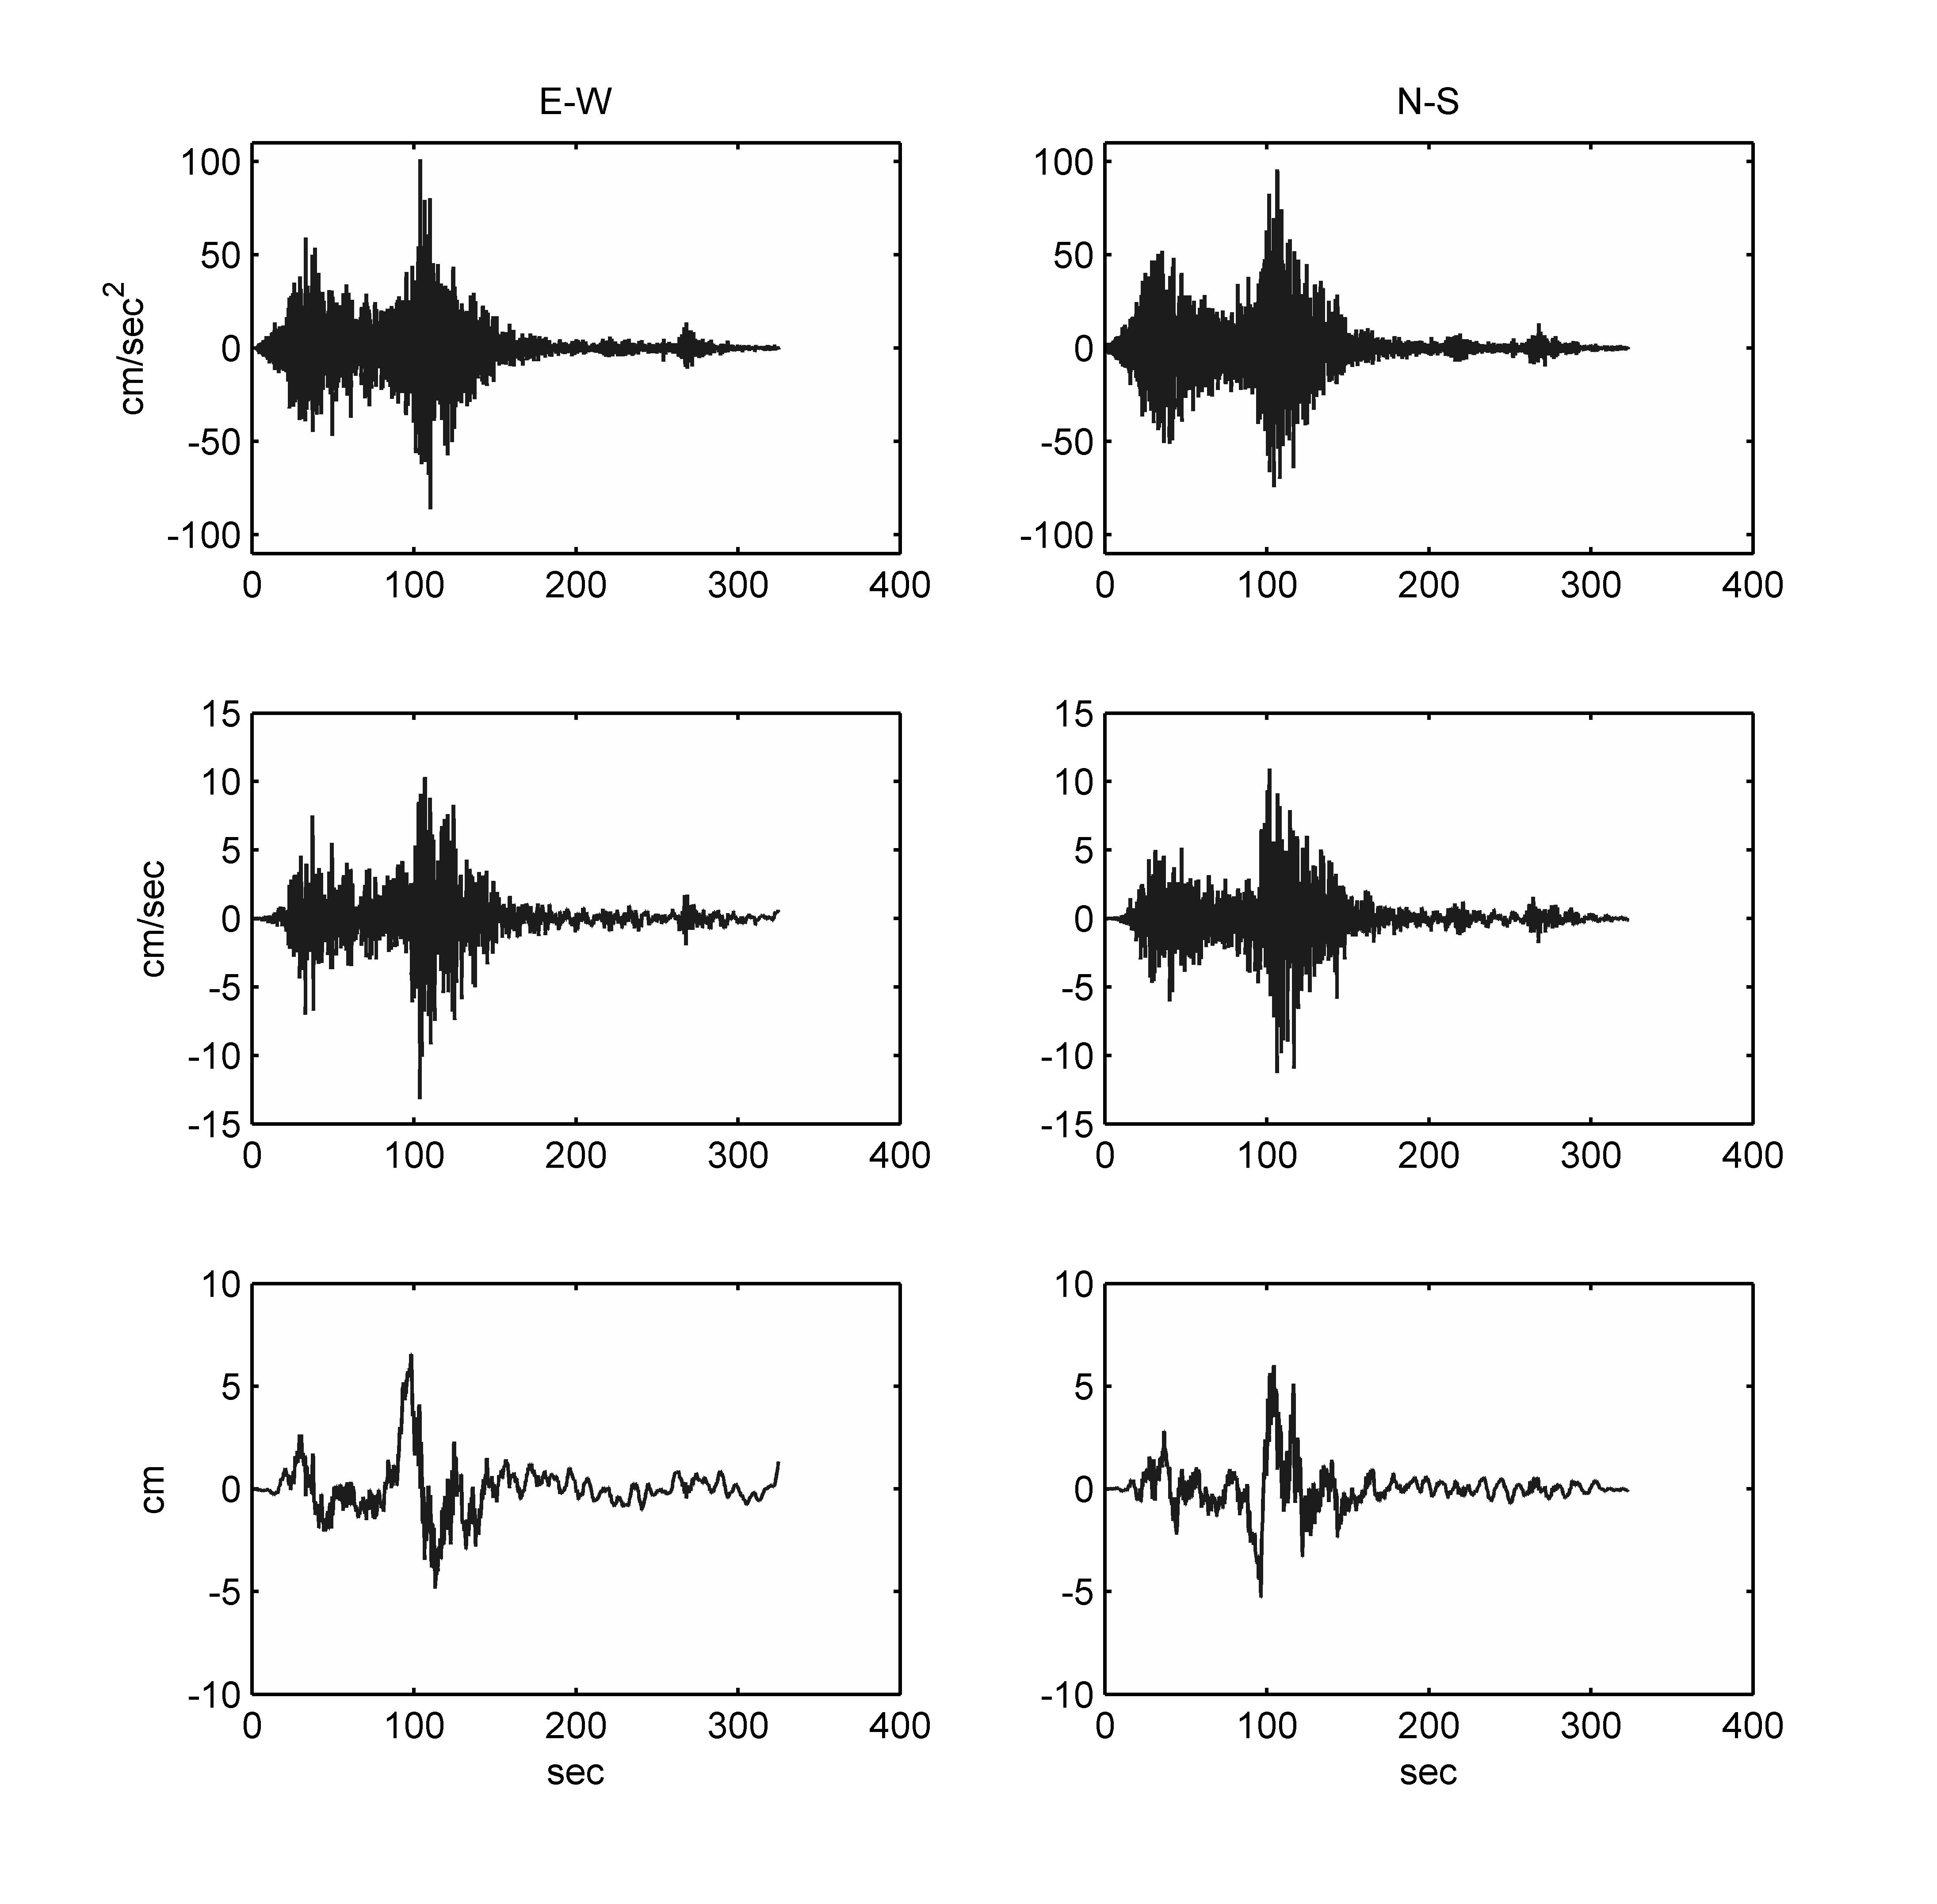 |
Figure 2.6. Acceleration, velocity, and displacement time histories for the El Callao record (soft soil). |
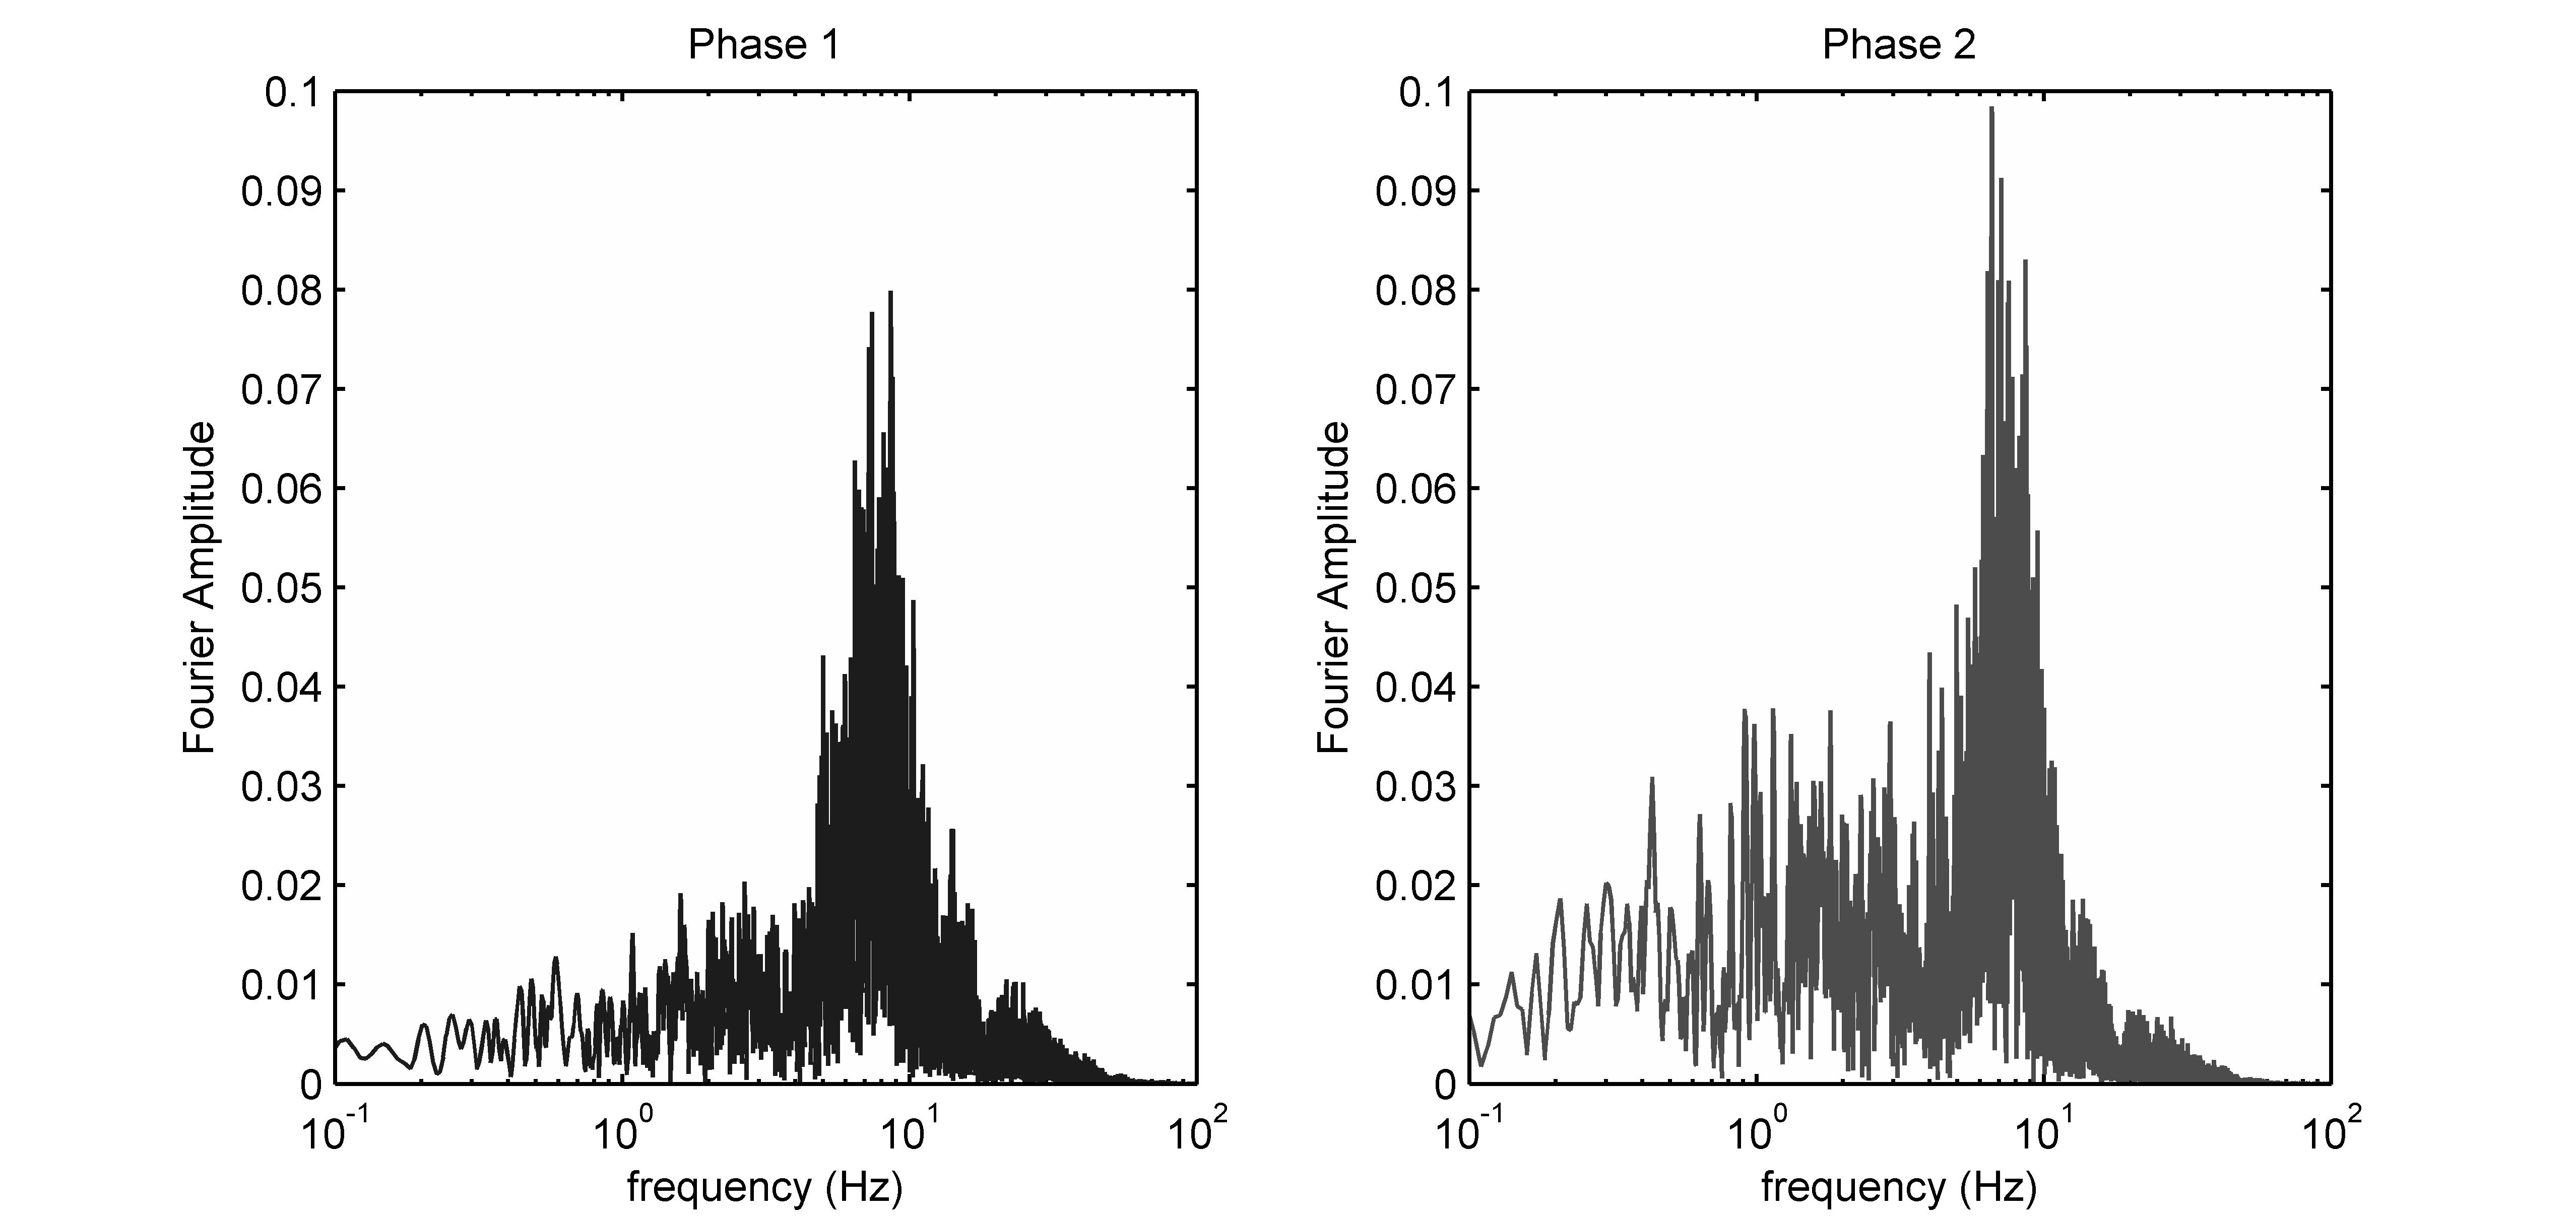 |
Figure 2.7. A windowed Fourier transform of each of the two phases of strong motion seen in Figure 2.5. Observe the amplification of long-period content in the second phase of motion. |